Edit Geo Map
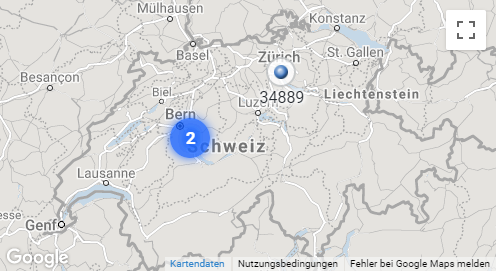
The geo map widget places objects on a Google map using lon/lat coordinates or address information. If multiple objects are located in the same area on the map, a cluster is built which can be clicked to drill down to the single objects. Clusters can contain from two up to several thousands of objects.
Settings panel
Setting | Description |
|---|---|
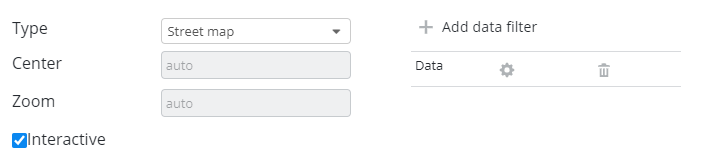
Type | Roadmap, Satellite, Hybrid, Terrain. |
Center | Initial map center as LAT/LON (e.g. 47.408384, 8.595708). |
Zoom | Initial zoom level. 0 (whole world) to 21+ (single building). |
Interactive | Activates controls like zooming and panning. |
Data filters (Objects)
Select SKOOR objects or data from a database to be displayed on the map. To add a data filter click on the Add data filter button.
SKOOR Objects are placed on the map as defined in the object property "Geo Location"
Setting | Description |
|---|---|
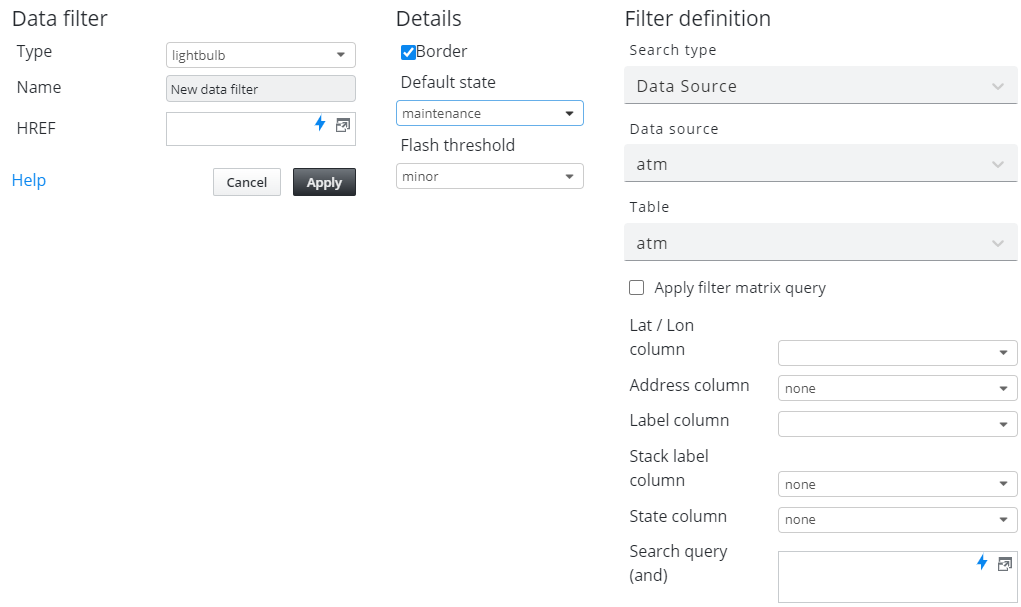
Type | Objects can be displayed as lightbulbs or heatmap. |
Name | Name to identify the data filter in the Geo map edit form. |
HREF | A hyperlink to follow if an object on the map is clicked (placeholders are supported) |
Border | Lightbulb is displayed with or without border |
Default state | Default lightbulb color/state |
Flash threshold | Lightbulbs in this state or worse are flashing |
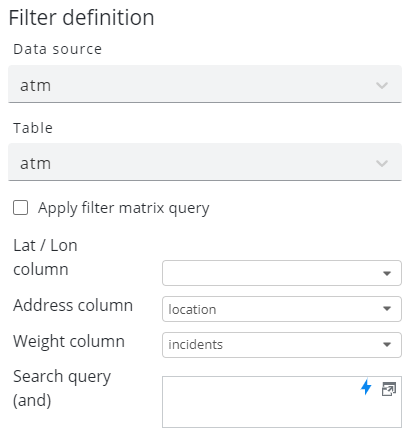
Lat / Lon column | Database column with latitude / longitude values used to position the lightbulbs or heat areas on the map (e.g. 47.408384, 8.595708) |
Address column | Used if no Lat / Lon column is available. The address will be searched on Google APIs |
Label column | Label of objects on the map |
Stack label column | Label of stacked objects. Will be displayed dependent of current zoom level |
State column | A database column containing the object state. Valid states are ok (green), warning (yellow), minor (orange), major (red), maintenance (blue), no data (grey) or undefined (white) |
Search query (and) | Use database attributes to filter objects (e.g. |
The Details settings are the same as in hotspot map.
Details about the Filter definition can be found in section Object filters.
Heat Map
This alternate way to display locations on a map uses an external datasouce to provide a numerical weigth value.
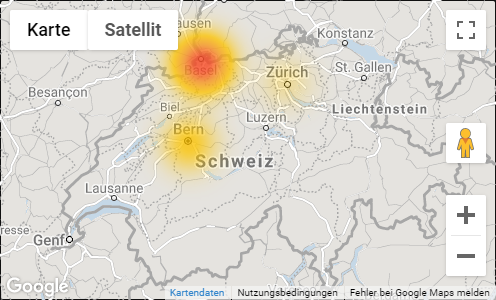
In the filter definition of the widget, configure either a database column containing coordinates in the Lat/Lon column field or use the Address column field with a database column containing for instance ZIP code and city. For coloration, configure the Weight column. The location with the highest weight (sum of weight column values) is colored in red, the lower values in orange to yellow.
If no weight column is configured, the coloration is calculated from the row count of each location