إحصاءات الدولة
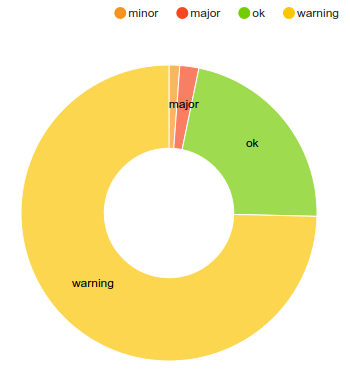
تعرض أداة الإحصائيات الحالة مخططًا دائريًا أو مخططًا حلقيًا لحالة كائن eRanger استنادًا إلى فترة زمنية محددة مسبقًا.
يظهر مثال على مخطط حلقي في الشكل التالي:
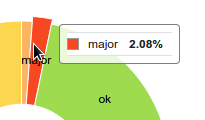
تظهر تفاصيل قيم النسب المئوية عند تحريك الماوس فوق أجزاء الرسم البياني:
تحرير أداة إحصائيات الحالة
يتيح اختيار أداة إحصائيات الحالة تكوين المعلمات التالية:
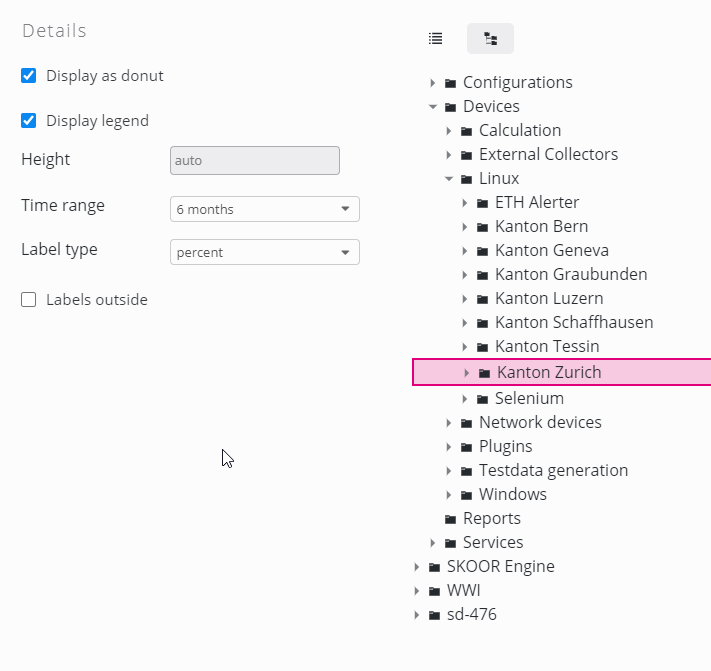
الإعداد | الوصف |
|---|---|
دونات | 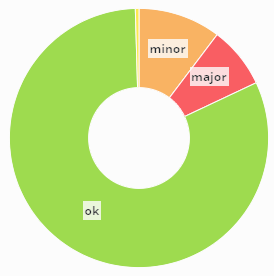 دونات مقابل كامل 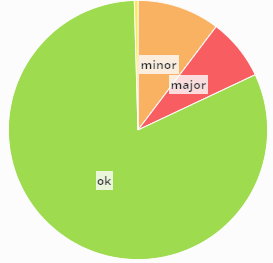 |
الشرح | عرض تفسير الحالة في الزاوية اليمنى العليا. |
الارتفاع | تعيين ارتفاع ثابت (بالبكسل). يحافظ المخطط دائمًا على نسبة العرض إلى الارتفاع. |
نطاق الزمن | النطاق الزمني لحساب الإحصائيات. |
نوع التسمية | اختر نوع التسمية:
|
الملصقات خارج | اضبط لإظهار التسميات خارج الرسم البياني. |