تاريخ القيمة
يعرض "سجل القيم" رسمًا بيانيًا زمنيًا لقيمة واحدة أو عدة قيم لمهمة SKOOR على خط زمني محدد مسبقًا. إذا لزم الأمر، يمكن تصدير القيم من الأداة بتنسيق CSV.
كما هو الحال مع سجل الحالة، يتم تقسيم الخط الزمني إلى عينات (يستخدم سجل القيمة حوالي 200 عينة). يمكن أن تعرض كل عينة إما الحد الأقصى (max) أو الحد الأدنى (min) أو المتوسط (avg) لجميع القيم المقاسة خلال فترة العينة الزمنية.
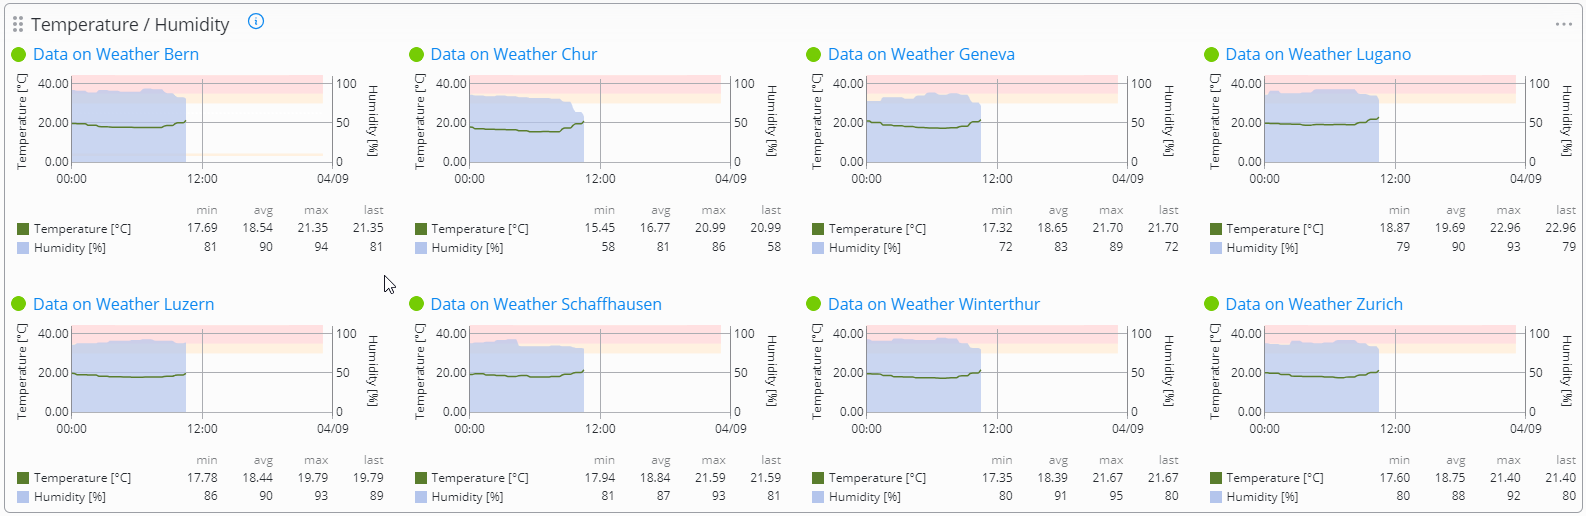
يسمح سجل القيم بتحديد محورين رأسيين، واحد على كل جانب من الرسم البياني. يمكن أن يعرض كل محور قيمة محددة (مثل درجة الحرارة والرطوبة ... إلخ). يمكن عرض
عدد غير محدود من كائنات SKOOR التي تقيس القيمة المكونة للمحور. وهذا يسمح بتراكب درجة الحرارة والرطوبة لمختلف المهام في نفس الرسم البياني على سبيل المثال.
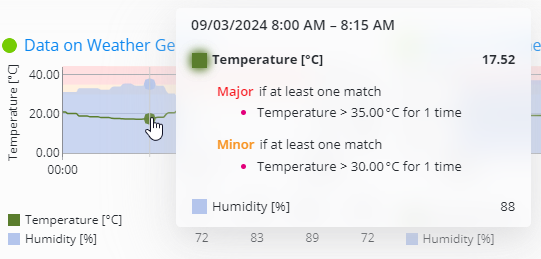
يمكن استرداد قيم العينة عن طريق تحريك الماوس فوق الخط الزمني:
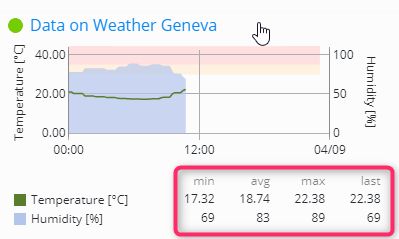
يمكن عرض القيم المجمعة الدنيا والقصوى والمتوسطة والأخيرة أسفل الرسم البياني:
يمكن عرض الحالات أو العتبات لإثراء الرسوم البيانية لسجل القيم إذا لزم الأمر. انقر فوق الرسم البياني لتحديد الحالات
أو العتبات:
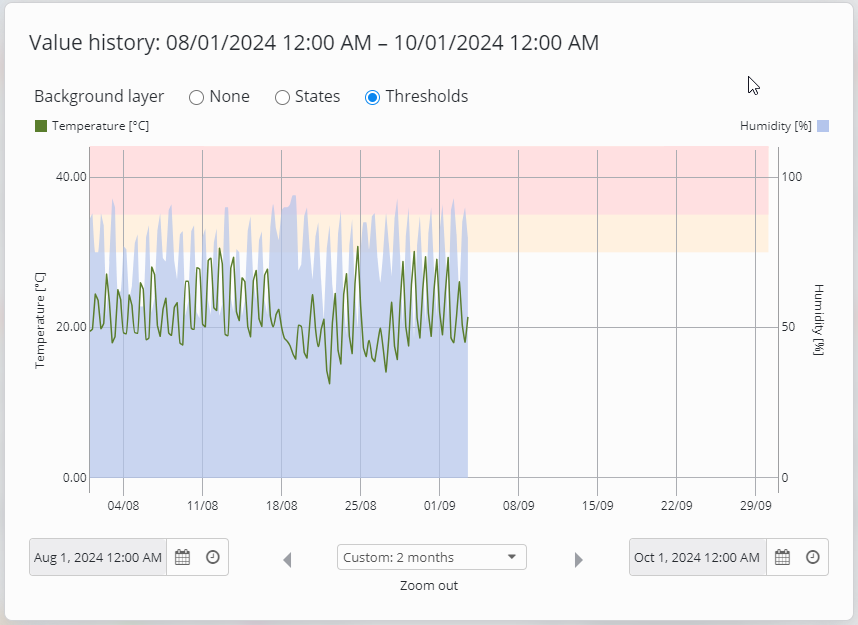
يتم عرض الأهداف مع العتبات عند تحديدها في محرك SKOOR. يوضح المثال أعلاه هدفًا قدره 5000 (الخط المنقط).
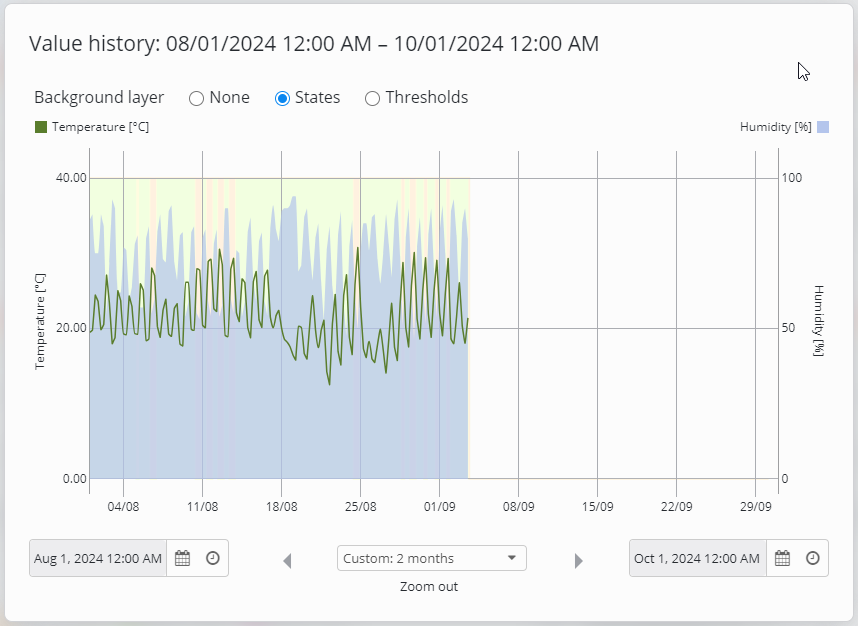
بالطبع، يمكن تعيين طبقة الخلفية بشكل دائم في وضع التحرير.
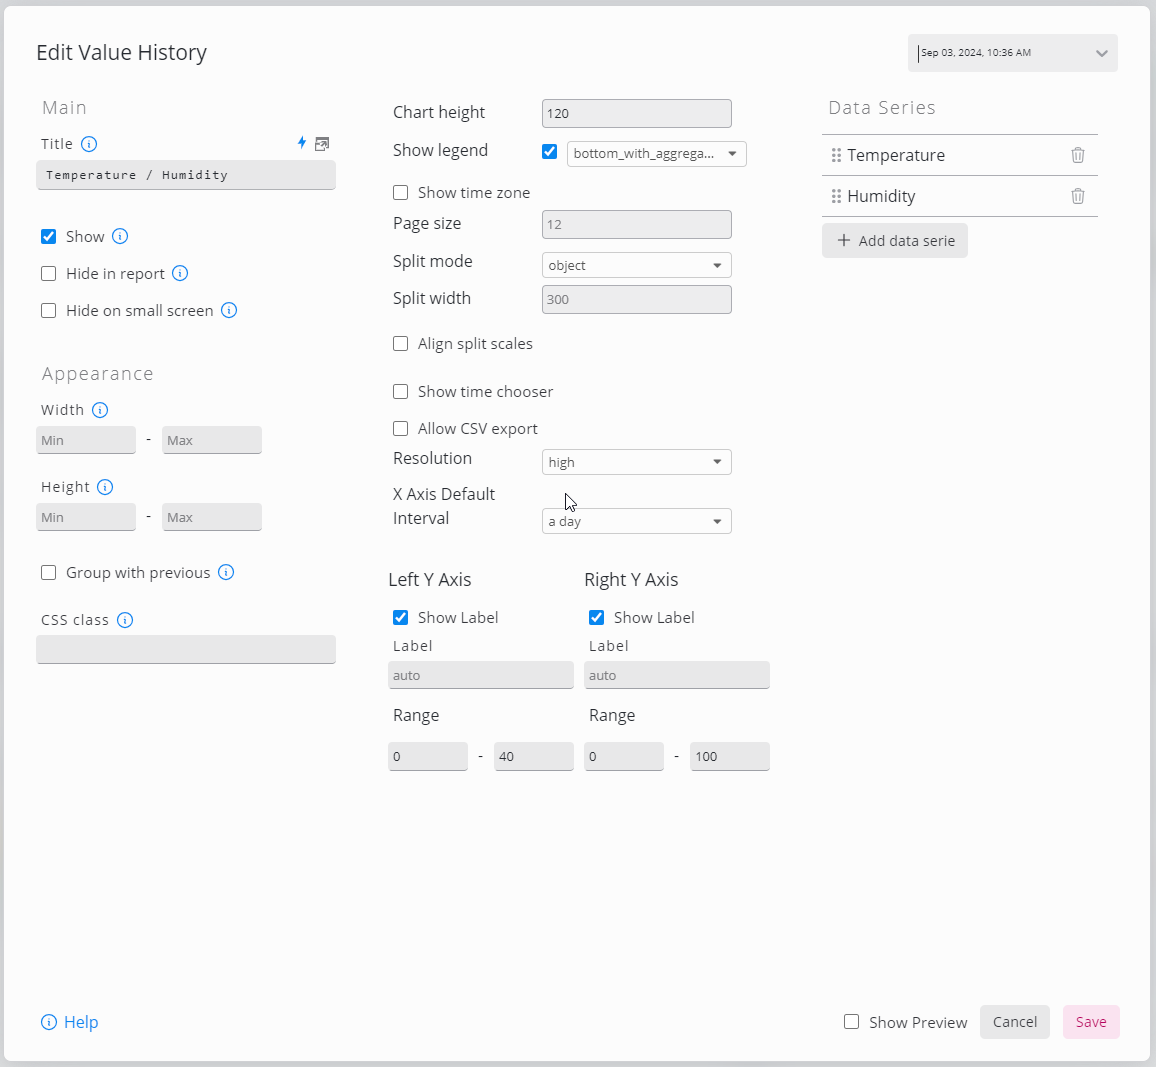
تحرير أداة سجل القيم
لإنشاء أداة جديدة لسجل القيم:
أضف سلسلة بيانات واحدة أو أكثر،
اختر ارتفاع الرسم البياني (اختياري)،
إذا كان يجب عرض نفس سلسلة البيانات لعدة كائنات، فقم بتكوين حجم الصفحة ووضع التقسيم وعرض التقسيم (اختياري)
قم بتمكين أو تعطيل تصدير CSV للبيانات المعروضة في الأداة،
قم بتشغيل أو إيقاف تشغيل جدول القيم المجمعة أسفل الأداة،
قم بتكوين المحور Y (اختياري)،
اختر نطاقًا زمنيًا على المحور X (اختياري).
الإعداد | الوصف |
|---|---|
ارتفاع المخطط | تعيين ارتفاع المخطط بالبكسل |
إظهار التسميات | اضبط علامة ما إذا كان يجب عرض التسمية التوضيحية أم لا.
|
إظهار المنطقة الزمنية | قم بتعيين علامة لإظهار المنطقة الزمنية |
حجم الصفحة | اضبط الحد الأقصى لعدد الرسوم البيانية التي سيتم عرضها على الأداة، وسيتم تقسيم الباقي إلى صفحات أخرى وسيظهر |
وضع التقسيم | حدد كيفية تقسيم الرسم البياني إلى عدة رسوم بيانية:
|
عرض التقسيم | حدد عرض الرسوم البيانية (بالبكسل) التي تم إنشاؤها بناءً على وضع التقسيم. |
محاذاة المقاييس المقسمة | اضبط لمحاذاة مقاييس الرسوم البيانية التي تم إنشاؤها بناءً على وضع التقسيم. |
إظهار محدد الوقت | اضبط لإظهار محدد الوقت في الأداة.  |
السماح بتصدير CSV | اضبطه لتمكين تصدير البيانات بتنسيق CSV. |
الدقة | حدد الدقة المطلوبة للرسم البياني:
|
الفاصل الزمني الافتراضي للمحور X | اضبط الفاصل الزمني الافتراضي للمحور X |


إضافة سلسلة بيانات
انقر فوق الزر "إضافة سلسلة بيانات" لإضافة سلسلة بيانات جديدة.
الخطوة الأولى هي تحديد كائن واحد أو أكثر من كائنات SKOOR Engine للحصول على البيانات منه. انقر فوق إضافة سلسلة بيانات واستخدم مرشح الكائنات لتحديد الكائنات المناسبة.
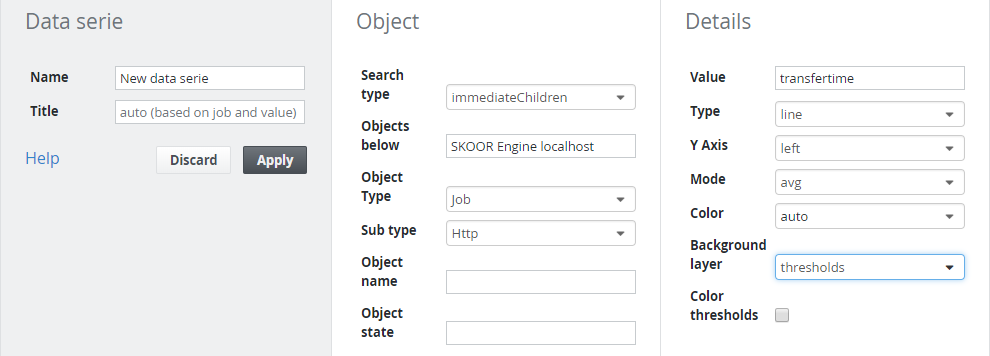
يمكن تكوين الإعدادات التالية لكل عنصر من عناصر سلسلة البيانات:
الإعداد | الوصف |
|---|---|
الاسم | اسم سلسلة البيانات. يُستخدم هذا لتحديد سلسلة البيانات في قائمة سلاسل البيانات في قناع تحرير سجل القيم. |
العنوان | عنوان سلسلة البيانات المخصص المستخدم في التسمية التوضيحية (اختياري). |
القيمة | تقدم بعض كائنات محرك SKOOR أكثر من قيمة قياس واحدة. اختر القيمة التي تريد الحصول على بيانات السجل لها. يقدم قسم قائمة مفاتيح قيم المهمة/SLC نظرة عامة على القيم |
النوع | خط أو منطقة (الافتراضي هو خط). |
المحور Y | اختر أي من المحورين الرأسيين ستستخدم لرسم سلسلة البيانات هذه (الافتراضي هو اليسار). |
الوضع | اختر وضع العينة (اختياري): avg (رسم القيمة المتوسطة لكل عينة زمنية. هذا هو الإعداد الافتراضي)، max (القيمة القصوى) أو min (القيمة الدنيا). لمزيد من التفاصيل، انظر سجل القيم |
اللون | لون مخصص (اختياري). |
طبقة الخلفية | يمكن إثراء سجل القيم بمعلومات الحالة أو الحد الأدنى. اختر أحد الخيارات التالية: لا شيء، الحالات أو الحدود الدنيا |
عتبات الألوان | إذا تم تحديد هذا الخيار، فسيتم عرض العتبات بألوانها المعروفة، وإلا فسيتم عرضها بدرجات اللون الرمادي. لا يظهر هذا الخيار إلا عندما يتم تعيين طبقة الخلفية على العتبات. لاحظ أن عتبات المشغل <> لا يمكن عرضها |
اختر ارتفاع الرسم
بشكل افتراضي، يتم تحديد ارتفاع الرسم تلقائيًا. ومع ذلك، باستخدام حقل الارتفاع، يمكن تحديد ارتفاع مخصص للرسم (بالبكسل).
تقسيم الرسوم البيانية / القيم المجمعة
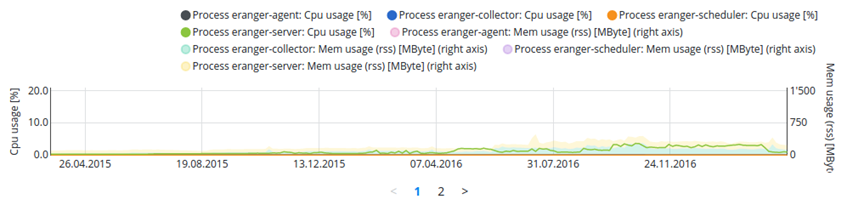
إذا كان من المقرر عرض بيانات أكثر من كائن واحد، فقد يكون من الأفضل تقسيم سلسلة البيانات إلى أكثر من رسم بياني واحد. يمكن القيام بذلك إما حسب الكائن أو حسب سلسلة البيانات.
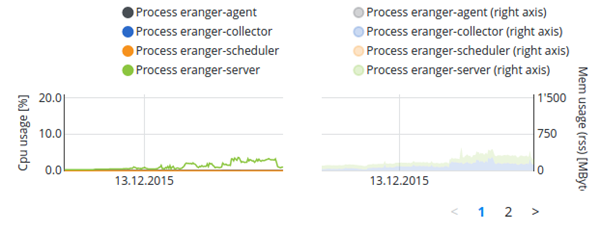
تُظهر الصورة التالية استخدام وحدة المعالجة المركزية والذاكرة لعمليات متعددة على جهاز واحد في رسم بياني واحد:
يمكن الآن تقسيم نفس البيانات كما في المثال التالي حيث تم استخدام سلسلة البيانات في وضع التقسيم:
إذا ظهر عدد كبير من الرسوم البيانية مع وضع التقسيم، يمكن استخدام حجم الصفحة لتقليل عدد الرسوم البيانية في كل صفحة. يحدد عرض التقسيم عرض كل رسم بياني معروض على الصفحات.
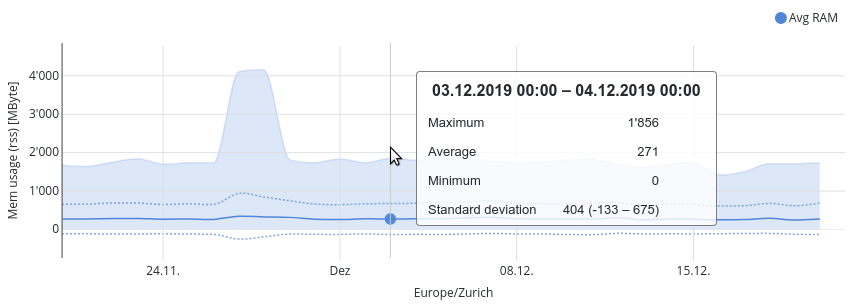
علاوة على ذلك، من الممكن عرض القيم المجمعة لجميع الكائنات داخل سلسلة البيانات. يعرض سجل القيم الناتج القيم المتوسطة والدنيا والقصوى والانحراف المعياري الناتج.
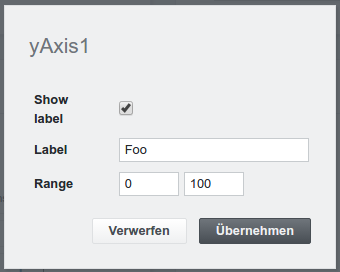
تكوين المحور Y
انقر فوق "تحرير y1" لتحرير المحور Y الأيسر أو "تحرير y2" لتحرير المحور Y الأيمن:
الإعداد | الوصف |
|---|---|
إظهار التسمية | إظهار أو إخفاء التسمية. |
التسمية | تسمية المحور Y (اختياري). إذا تركت فارغة، يتم إنشاء التسمية من قيمة الكائن. |
النطاق | نطاق القيمة على المحور Y (اختياري). بشكل افتراضي، يتم تحديد النطاق من القيم المحددة. |
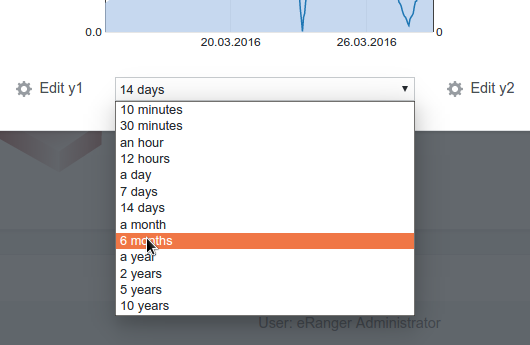
اختر نطاق الوقت على المحور X
استخدم مربع التحديد لتعيين نطاق الوقت المراد عرضه.
تصدير
لا يتوفر خيار تصدير CSV إلا إذا تم إعداده بشكل صحيح في إعدادات عنصر واجهة المستخدم
قم بتشغيل <تصدير CSV> على الأداة
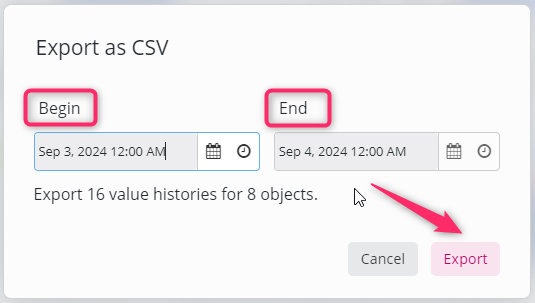
اضبط تواريخ البدء والانتهاء المطلوبة لتقرير CSV.
قم بتشغيل <تصدير>
سيتم تنزيل التقرير.
الإعداد | الوصف |
|---|---|
البداية | تاريخ بدء تصدير ملف CSV المطلوب. |
النهاية | تاريخ انتهاء تصدير CSV المطلوب. |