State Statistics
The State Statistics widget shows a pie- or donut chart of an eRanger object's state based on a predefined time period.
An example of a donut chart is shown in the following figure:
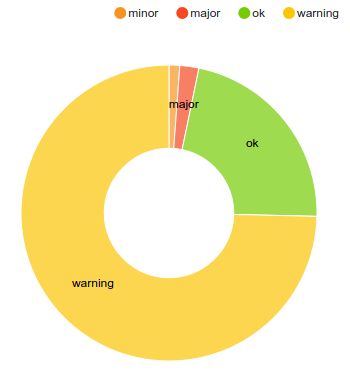
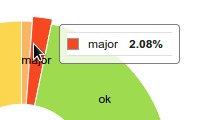
Details of the percentage values are shown when moving the mouse over the segments of the plot:
Editing state statistics widget
Choosing a State statistics widget allows configuring the following parameters:
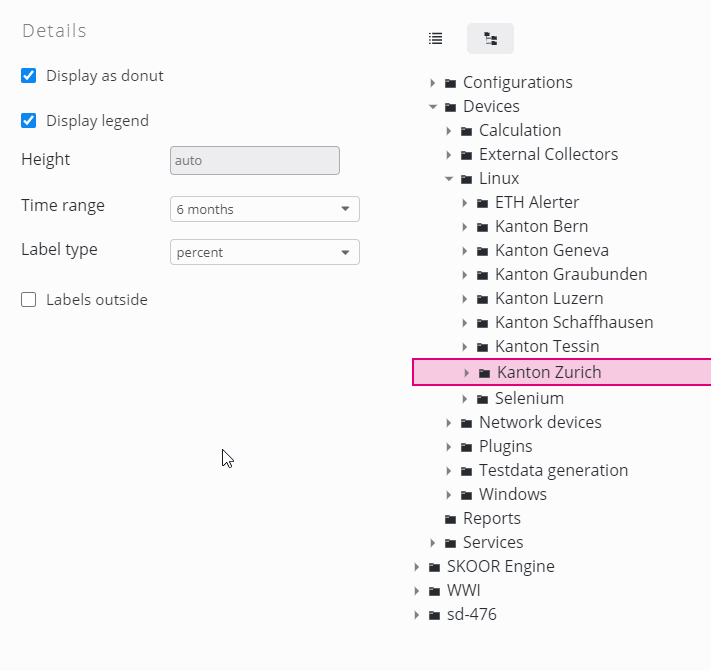
Setting | Description |
|---|---|
Donut | 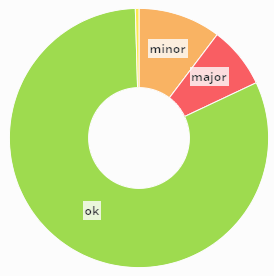 Donut vs. Full 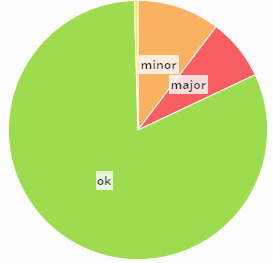 |
Legend | Show State legend in the top right corner. |
Height | Set fixed height (in pixels). The chart always keeps its aspect ratio. |
Timerange | Timerange to calculate the statistics for. |
Label type | Pick the type of the Label:
|
Labels outside | Set to show the labels outside of the graph. |