Object state history
When clicking the state history button from Detail view, the following overlay is displayed:
It shows the current object's state history bar but offers additional functionality.
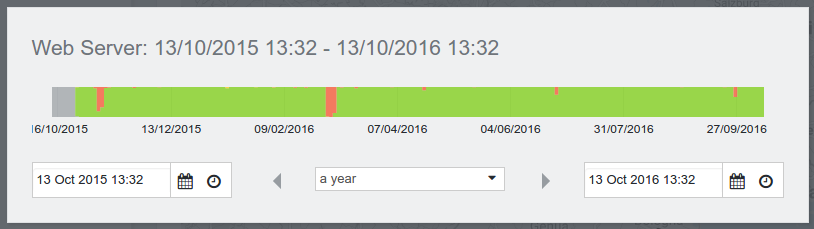
Dragging the mouse over the bar from left to right or vice versa allows zooming into the timeline. The selected time range is highlighted with a darker colour:
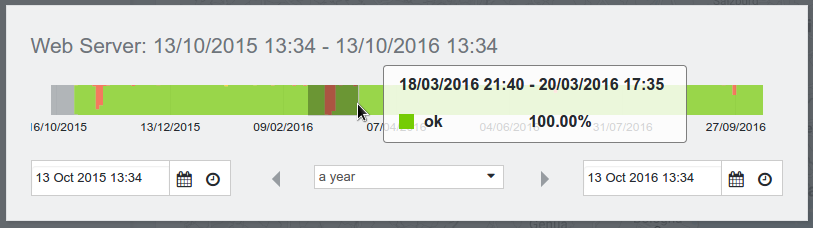
Moving the mouse across the bar shows the corresponding percentages of the states the object was in during that time sample.
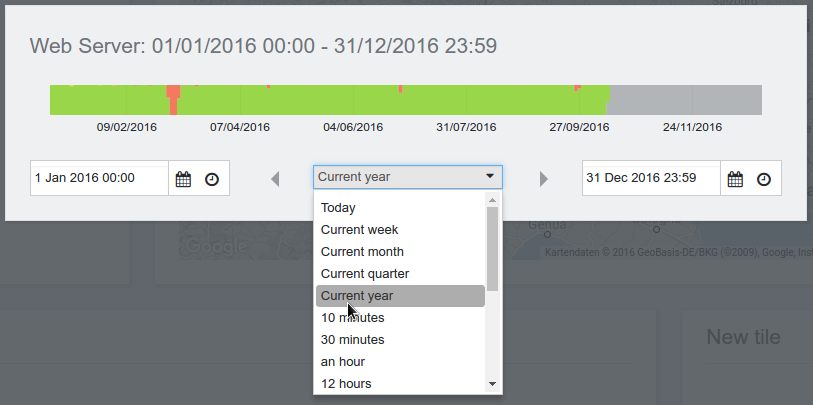
The time range can be influenced also by setting a start and end time from the two calendar widgets, by selecting a predefined time range from the dropdown list or by moving the displayed frame using the arrow buttons: