Statistics
Access Log
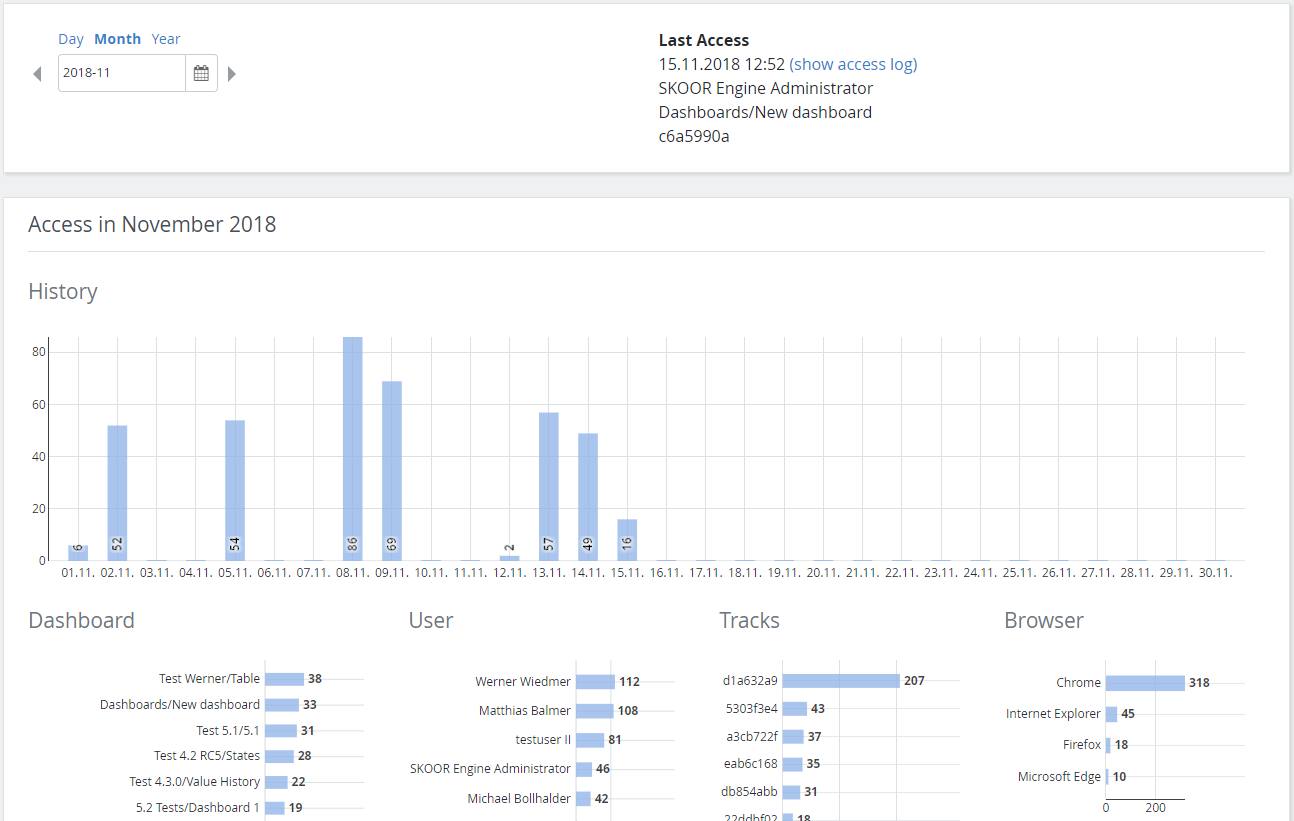
Dashboard access is logged per dashboard and user. To see which dashboards have been accessed in a certain timerange, the stats page can be opened in the browser:
https://<host>/skoor-dashboard/#/stats
First, the overview page opens and shows an access history timeline diagram, dashboard names, users and browser types of the requests in the time period selected with the date picker. The Tracks column shows access combined by PC/browser pair. For more details, the requests can be drilled down by clicking one of the bars.
The Last Access section shows the lastmost dashboard access. By clicking the link show access log, the log is displayed in form of a table.
By clicking one of the URLs, the dashboard of the respective request opens with the same parameters as the original request.

