Show syslog
Using SKOOR Engine as syslog server
Syslog messages from internal or external sources can be displayed. The local rsyslog daemon can be configured to allow incoming syslog traffic. A template configuration file is available on the SKOOR Engine host. The configuration will work as is if it is renamed to .conf:
# mv /etc/rsyslog.d/eranger-rsyslog.conf.example /etc/rsyslog.d/eranger-rsyslog.conf
# service rsyslog restart (Redhat 6)			or
# systemctl restart rsyslog.service (Redhat 7)
then restart the syslog service using one of the following commands:
# service rsyslog restart						(Redhat 6)
# systemctl restart rsyslog.service				(Redhat 7)
The SKOOR Engine server will now listen on the default UDP syslog port 514 for incoming syslog traffic.
Syslog sources
To use SKOOR Engine as a syslog server for remote syslog clients, the log-generating client needs to be set up to send its syslog output or part of it to SKOOR Engine.
sylog-ng
syslog-ng example configuration assuming SKOOR Engine server has the IP address 10.1.1.76:
...
destination loghost { udp("10.1.1.76" port(514)); };
log { source(src); destination(loghost); };
...
rsyslog
rsyslog example configuration assuming SKOOR Engine server has the IP address 10.1.1.76:
...
*.*        @10.1.1.76:514			(sends all syslog output to SKOOR)										or
cron.*     @10.1.1.76:514			(sends only cron syslog output to SKOOR)								or
*.info     @10.1.1.76:514			(sends only syslog output of severity info or higher to SKOOR)
...
Windows
To have a Windows machine send its event logs, one can use the Eventlog to Syslog utility evtsys from the Windows installation CD’s Windows Tools directory.
Syslog output
The syslog output received by the SKOOR Engine's rsyslog daemon are written to files, separated by severity, below the following path:
$ ls -1 /var/opt/run/eranger/collector/tmp/syslog/

messages.csv_alert
messages.csv_alert.1
messages.csv_alert.2
messages.csv_alert.3
messages.csv_alert.4
messages.csv_alert.5
messages.csv_alert.6
messages.csv_alert.7
messages.csv_alert.8
messages.csv_crit
messages.csv_crit.1
messages.csv_crit.2
messages.csv_crit.3
messages.csv_crit.4
messages.csv_crit.5
messages.csv_crit.6
messages.csv_debug
messages.csv_debug.1
messages.csv_debug.2
messages.csv_debug.3
messages.csv_debug.4
messages.csv_debug.5
messages.csv_debug.6
messages.csv_debug.7
messages.csv_debug.8
messages.csv_err
messages.csv_err.1
messages.csv_err.2
messages.csv_err.3
messages.csv_err.4
messages.csv_info
messages.csv_info.1
messages.csv_info.2
messages.csv_info.3
messages.csv_info.4
messages.csv_info.5
messages.csv_info.6
messages.csv_info.7
messages.csv_info.8
messages.csv_notice
messages.csv_notice.1
messages.csv_notice.2
messages.csv_notice.3
messages.csv_notice.4
messages.csv_notice.5
messages.csv_notice.6
messages.csv_notice.7
messages.csv_notice.8
messages.csv_trap
messages.csv_trap.1
messages.csv_trap.2
messages.csv_trap.3
messages.csv_trap.4
messages.csv_trap.5
messages.csv_trap.6
messages.csv_trap.7
messages.csv_trap.8
messages.csv_warning
messages.csv_warning.1
messages.csv_warning.2
messages.csv_warning.3
An example output of the messages file contents describes the format of the syslog output originating from the SKOOR Engine localhost:
20170929000301;skoor-centos-master;authpriv;sudo; pam_unix(sudo:auth): auth could not identify password for [eranger]
The format of the messages files is defined in the SKOOR Engine rsyslog configuration:
/etc/rsyslog.d/eranger-rsyslog.conf
Default format configuration:
$template eranger-format,"%$year%%$month%%$day%%$hour%%$minute%%timestamp:F,58:3%;%fromhost%;%syslogfacility-text%;%programname%;%msg%\n"
Display device syslog
The above output can also be viewed on the SKOOR Engine device object itself using the Show Syslog function from the device's dropdown list.
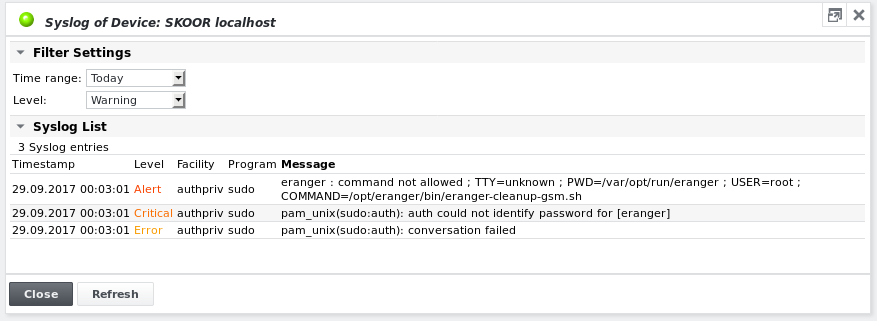
If the device's address field contains the device's host name or IP address as it appears in the syslog message files then the syslog output is shown:
If nothing is displayed, then the host name, as it appears in the syslog messages, probably doesn't correspond to the device's address field contents. See section Device Syslog for details on how to map the hostname to the address field.
By default, the log is sorted by Timestamp and shows today's syslog output. The above figure shows the output for Warning which means all messages with a severity of Warning or higher are printed. To inverse sorting, click on one of the column headers of the Syslog List table. Different colours represent different message severities.
Select syslog time range
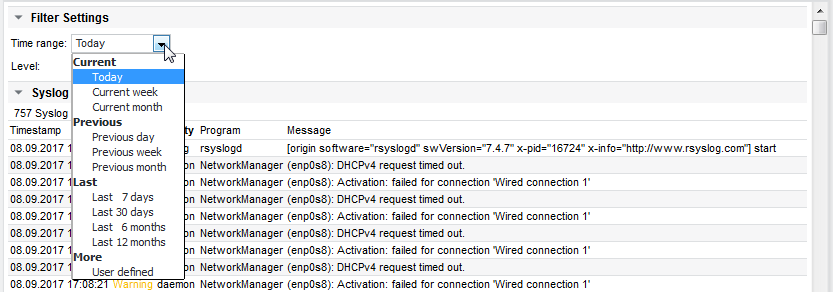
Select the time range which should be displayed:
Select syslog level
Select the severity level of the messages which should be displayed:
In this example, Info messages and above are shown. The default level can be set individually using the Syslog Level property on the device object menu. See the next section for examples.
Device syslog definition
Syslog source
If the device does not refer to itself with its DNS name in its address field, the Syslog source property needs to be added to the device's object with the host name as value:
To receive messages for all devices that send their syslog to SKOOR, enter * instead.
To receive messages logged to the file (in case rsyslog is configured to write to a custom logfile, which doesn't exist by default)
/var/opt/run/eranger/collector/tmp/syslog/messages_SAN
and originating from the host with the IP 10.1.1.134, use the following entry:
Syslog Level
Add the Syslog Level property to configure the default severity level.
Parse syslog messages
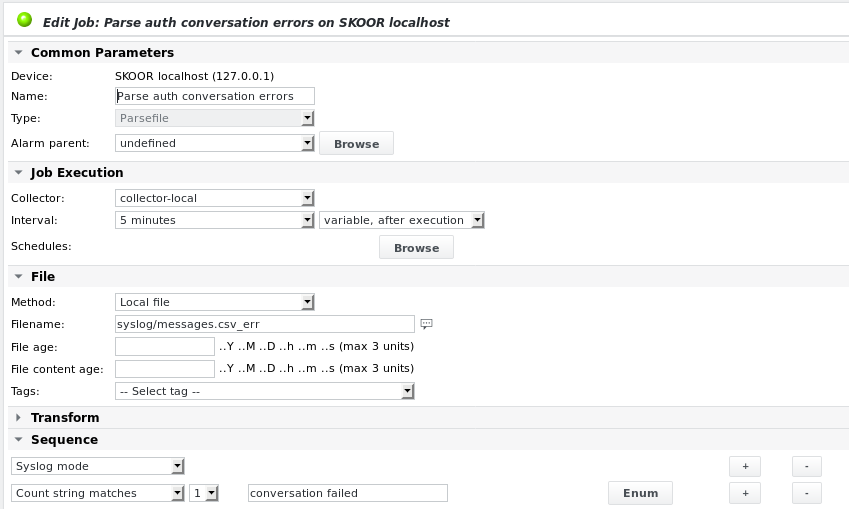
To issue alarms based on syslog messages, add a new parsefile job and select an existing syslog file as Filename, e.g. syslog/messages.csv_err. Syslog files, when rsyslog is configured with the SKOOR Engine default configuration, are stored in the following location:
/var/opt/run/eranger/collector/tmp/syslog/
The figure below shows an example to parse the following message for the string conversation failed.
20170929142855;skoor-centos-master;auth;root; sudo: pam_unix(sudo:auth): conversation failed
Job configuration using syslog mode:
The alarm limits can be set to issue a Major alarm if the string has been logged more than 3 times during the time since the job's last run:
The job output in case there have been more than 3 lines found:


