Outage History
The Outage History widget extends the capabilities of other time and state-dependent widgets by a navigable graph, based on outage lists provided by the SKOOR Engine. It can be used to just display outages of a preselected time range, or, with navigation enabled, also to control other time-dependent widgets. Using the "Previous outage" and "Next outage" buttons or the date and time picker, the blue marker will be moved between visible outages in the widget. Other time-dependent widgets on the dashboard will change and display their states at the same point in time.
Moving the marker to the outage at 11:11h, the red lightbulb in the job table reveals that the "Random Number" job caused the outage:
Outage details will be displayed on mouse-over:
Considered states, the minimal outage duration, and other settings are configurable.
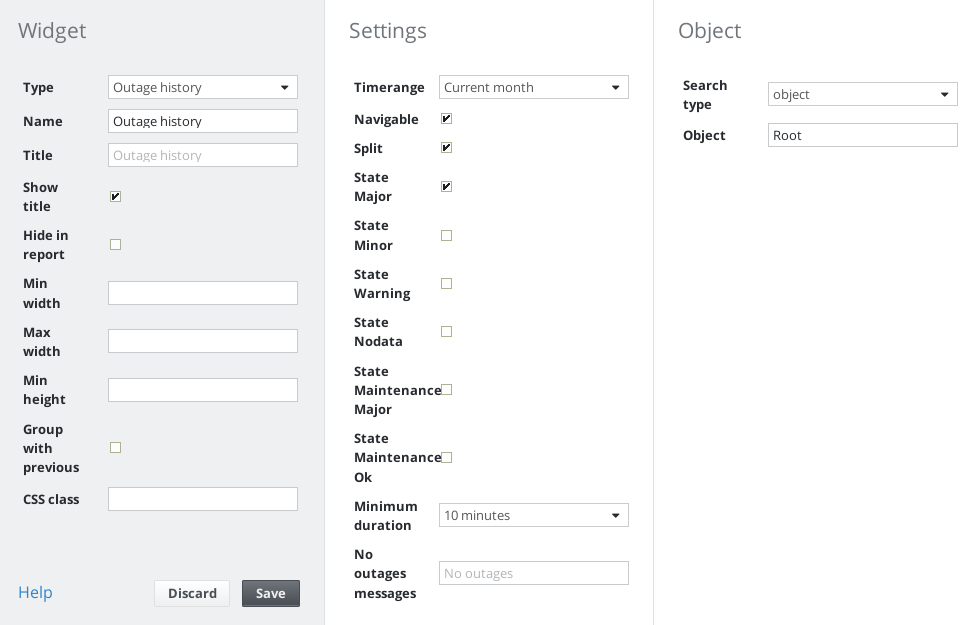
Editing outage history widget
As in many other widgets, besides the general widget configuration, SKOOR Engine objects must be defined in the object section to provide data for the widget. In this context, the provided data will be an outage list. Details on filtering objects are described in the object filter guide.
Settings
The following table describes the available settings and their purpose. To get the best benefit of the widget, a good balance between time range and minimum duration must be found. Please note that the number of outages displayed in the widget is limited to 200.
Setting | Description |
|---|---|
Timerange | Defines the start and endpoint of the graph. Navigation outside this timerange is currently not supported |
Navigable | Set navigation in the widget active/inactive. This feature can be used also to control other time dependent widgets in the current dashboard |
Split | Enable this flag if different states that are adjacent to each other should be split and given as single states:
Otherwise, states != OK that are adjacent are combined into one outage: |
State Major, Minor, ... | Consider this state as outage |
Minimum duration | Only outages with a duration >= the minimum duration are displayed. This feature helps to keep the graph from being filled up with short outages that might not be of interest |
No outages message | The message text to display in case no outage occured in the configured timerange |

