Show state history
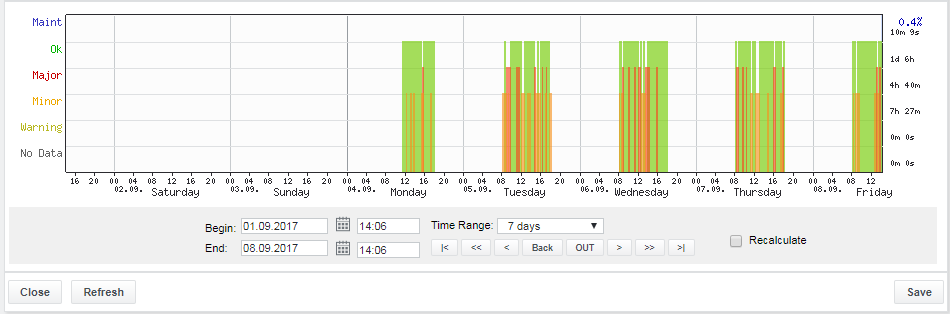
The state history shows the state of objects as a function of time. See section Object states and colors for a description of possible states. Time range and zoom work the same way as in value history plots.
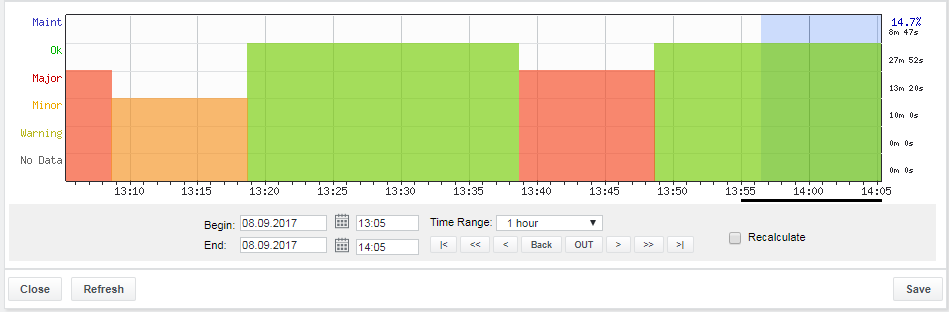
To display an SLO's active time only, hide the undesired time ranges by adding the corresponding SLC. To achieve this, the graph must be saved and edited accordingly.