SLA Monitor
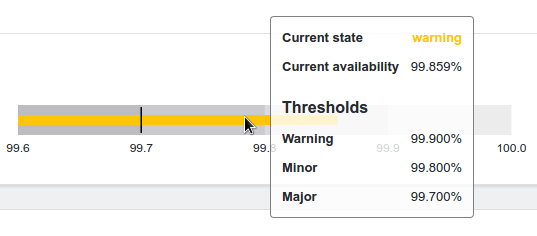
The SLA Monitor shows the current availability of an SLA within the current time period.
The gray areas indicate the configured thresholds of the SLA
The right side shows the trend of the availability since the beginning of the current time period. The exact values of the current availability and configured thresholds can be shown by moving the mouse over the horizontal bar:
Clicking the bar opens the detailed view of the SLA.
Editing SLA monitor widget
Settings
The only setting of the SLA monitor is the linked eRanger object. Only SLC objects can be chosen here:
Setting | Description |
|---|---|
Show Label | When enabled shows the label in front of the bullet chart |
Show Value | When enabled shows the value after the bullet chart. |
Show History | When enabled shows the history as a sparkline. The sparkline allows a click to get a more detailed history. |


