OPM configuration settings
New configurations can be added in /root/Configurations/Operations Monitor. Once added, configurations can be edited directly in OPM by choosing an OPM configuration from the dropdown menu at the lower right and clicking the Settings button.
Common parameters
| Parameter | Description |
|---|---|
| Name | Name of the OPM configuration |
| Refresh interval | The time between the automatic refresh of the browser. The refresh is handled by the browser. |
Overview
Select the overview types which should be displayed. Click on “+” to add more objects.
Favorite objects
Select previously browsed objects that one would like to display in more detail as Favorites.
Alarm list filter
The alarm list filter list defines what type of events should be displayed. By default, all items in the alarm list are shown. Set the filter for objects that should not appear by: State, Event type, Last change, Duration or Object type. Add more filters with the “+” button. To be able to select an object, browse for it first with the Browse button, then select it. The selected objects will appear in the dropdown list.
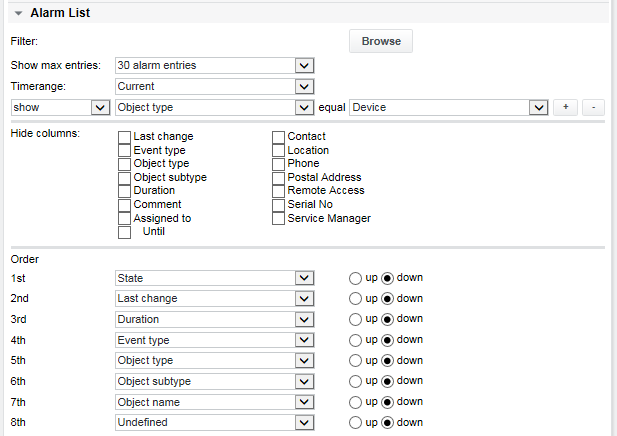
The configuration below will show a maximum of 30 current alarms for devices. No alarms on jobs or other objects will be shown. To disable the alarm list completely, for example to only display syslog messages, choose Hide alarm list from the Show max entries list. To see also already closed alarm events, a time range can be set in the respective dropdown list.
Any SKOOR Engine object can be browsed for with the Browse button first and then selected for filtering in the Object dialog, as shown with an HTTP job in the following example:
If a job with an open alarm (state not OK) is stopped or becomes inactive due to a schedule configured on the job, the alarm stays open and the job is shown in the alarm list with the state undefined.
Alarm children can only be hidden, not shown.
Here is an example where only alarms issued by the Demo and Training devices are shown. The time range was set to Today, so alarms that changed to state OK during the day are displayed as well:
The entries below the columns Event type, Object name and Assigned to can be used to open the alarm list of an object, the object itself or assign the alarm to a specific user. Please see section Show alarms for details on alarm lists and assignment.
The following alarm list is shown after clicking the Event type link on the fourth line in above example:
The Close button closes the alarm list as well as OPM.
Alarm List columns to show
The Hide columns section specifies which columns should not be displayed in the alarm list.
Alarm List order
The alarm list Order section allows changing the sort order of the alarms by various parameters. The up and down radio buttons set the sort direction of a column to either ascending or descending:
Syslog filter
This function is useful to show syslog messages from remote hosts that send their log output to SKOOR Engine via syslog. By default, only the messages of the SKOOR Engine server are shown. Remote hosts need their syslog daemon configured to forward their messages to SKOOR Engine’s rsyslog daemon. SKOOR Engine verifies the Address field on each device to check if there are syslog entries for the corresponding device. If the device appears with a different name in syslog than is configured in its Address field, its Syslog source property needs to be adjusted.
Define the maximum number of entries (or select Hide syslog to disable) and the time range. Selecting a show item automatically hides all other objects which are not explicitly shown also. Click the Browse button to select an object (e.g. a device).
Configure the following to only show syslog messages from devices which have been selected in the Alarm list section using its Filter → Browse button:
This is useful to only display messages which also have an error state.
The example below shows up to 10 syslog messages for the SKOOR Engine server of the last 7 days for severity levels Info and above.
The device name parameter allows adding a regular expression pattern for device name comparison. The host entry in the syslog messages is compared with the Syslog source property of all devices so SKOOR Engine can link the messages output of remote systems with the SKOOR Engine devices. If the Syslog source property of a device which should appear in the syslog list is not defined, SKOOR Engine tries to make the link using the Address field of the device (the device Address field needs to contain the device hostname in that case, not its IP address). Here, all devices of type Firewall will be shown where hostname starts with dev-:
Syslog order
The syslog can be sorted by the severity level of its messages, by the host name or by other parameters. The sorting can be influenced by the position in the list and using the up and down radio buttons which set the sort direction to either ascending or descending:
The filtered syslog messages are colored according to their severity.
Scheduled maintenance
Scheduled maintenance windows can be displayed in the operations monitor.
| Parameter | Description |
|---|---|
| Show max entries | Number of entries to display |
| Timerange | Show scheduled maintenance for the selected time range |
OPM view with Scheduled maintenance option configured:
The lightbulbs on the left side of the list show the current state of the object. The maintenance shown in the top row is currently active.


