Aggregate functions and pivoting
Aggregate functions and pivoting can be used to group and aggregate data in a database table.
The basic functionality is best explained by a simple example.
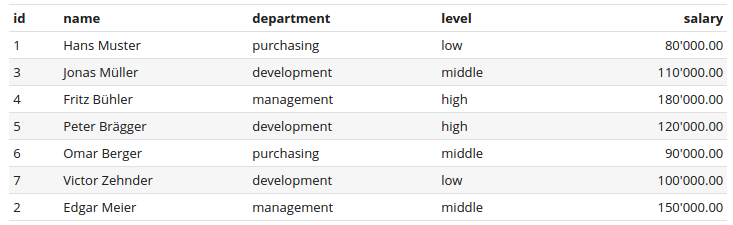
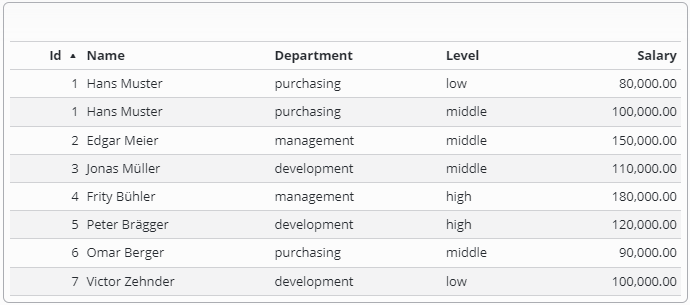
We have a table (not normalized for the sake of simplicity) which contains employees of a company. Each employee has a name, belongs to a department, has an experience level and a salary.
Now let's see how we can squeeze some useful information out of this dataset.
Salaries by employee
This is the simplest form of information. Just display the name of the employee together with its salary. This doesn't need any aggregate function or pivoting at all.
Table
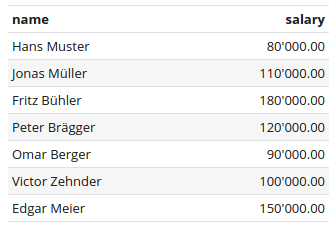
The table consists of two columns, one for the name and one for the salary, both without an aggregate function.
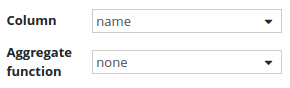
Name column configuration
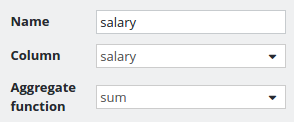
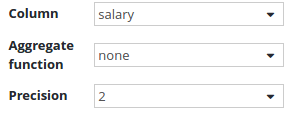
Salary column configuration:
Chart
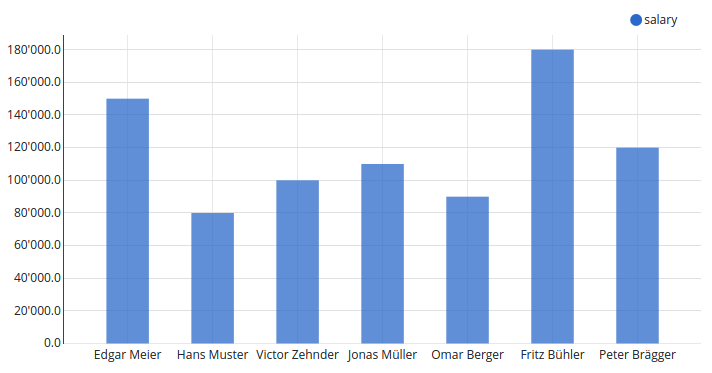
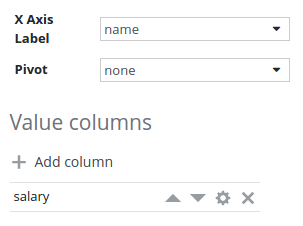
Chart configuration
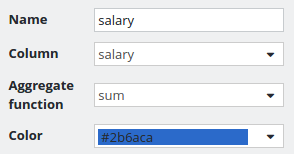
Salary value column configuration
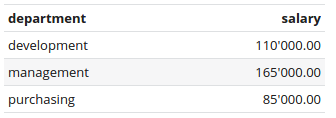
Summarized salaries grouped by department
Table
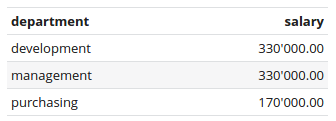
Department column configuration:
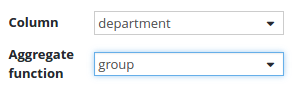
The employees are grouped by the department.
Although group is in the Aggregate function drop down list, it is not really an aggregate function. Aggregate functions aggregate values (sum, count, avg, min, max) whereas group does just group rows together.
Salary column configuration:

Because we already have grouped the employees by department, all other columns have to use an aggregate function. In this case we want to summarize the salaries of employees within a department.
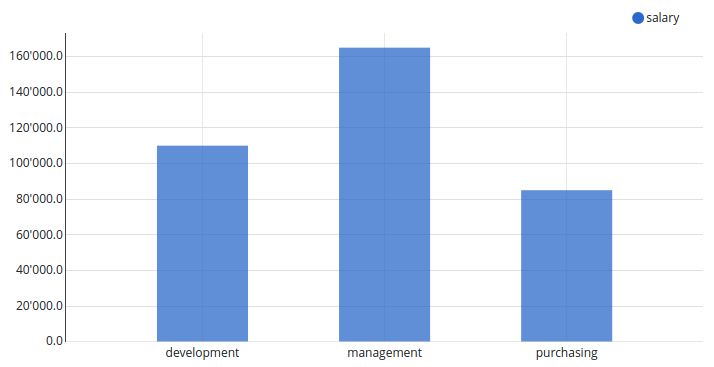
Chart
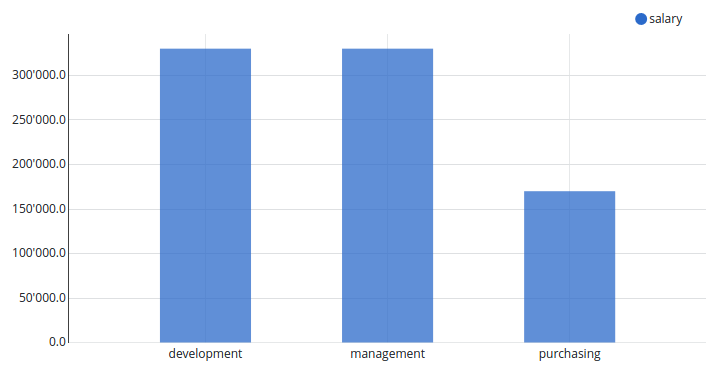
Chart configuration
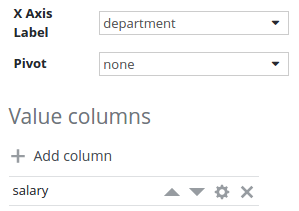
Rows are automatically grouped by the column selected as X axis label.
Salary value column configuration

Average salaries grouped by department
Same configuration as in the above example, except the aggregate function of the salary column is set to avg instead of sum.
Table
Chart
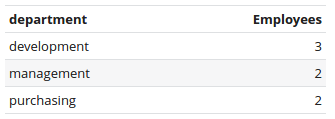
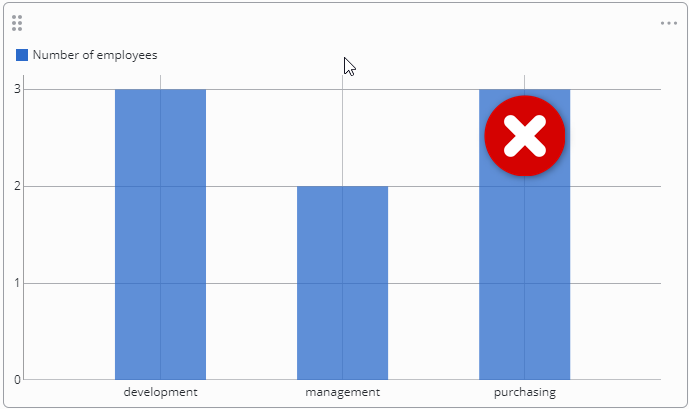
Number of employees grouped by department
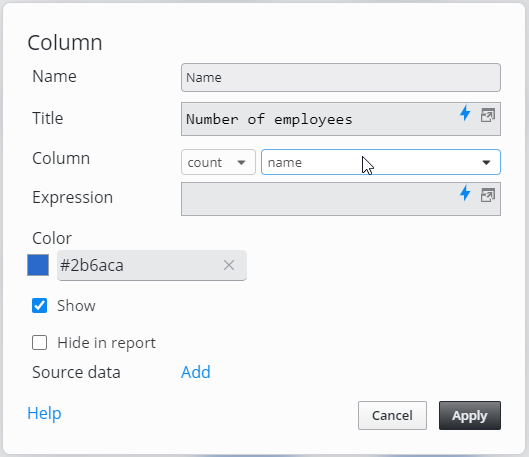
Same configuration as in the above example, except the aggregate function of the salary column is set to count instead of sum.
Table
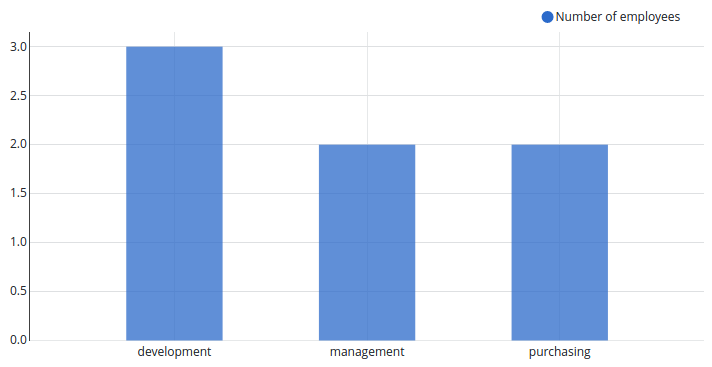
Chart
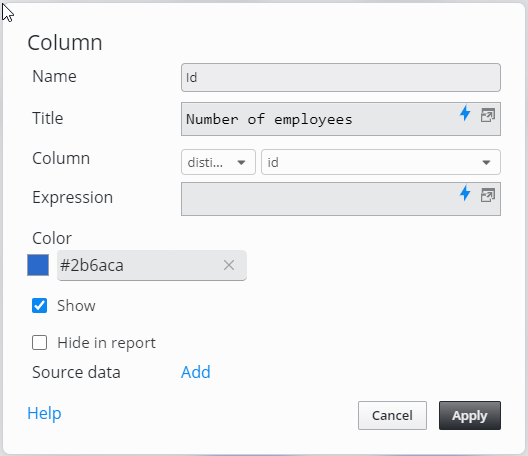
Special case (Distinct_count):
If the original data set included multiple entries of the same person, this could mean that the person got a raise.
The salary raise is represented as a new entry in the table (this helps keep track of the old salary info)
In the below screenshot, Hans Muster has got a raise, so his new salary is (100'000.00)
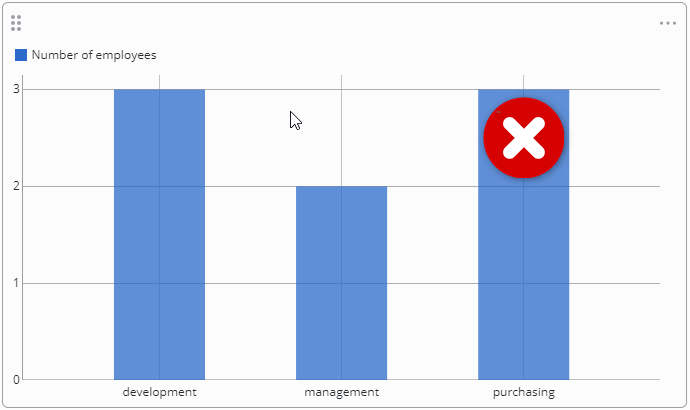
Using the previous settings to calculate the number of employees grouped by department would lead to counting Hans twice.
changing the aggregate function from count(salary) to count(name) would still have the same false result as shown below:
Using count(salary)
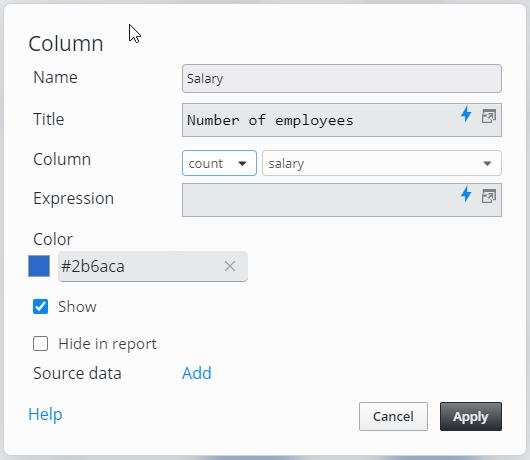
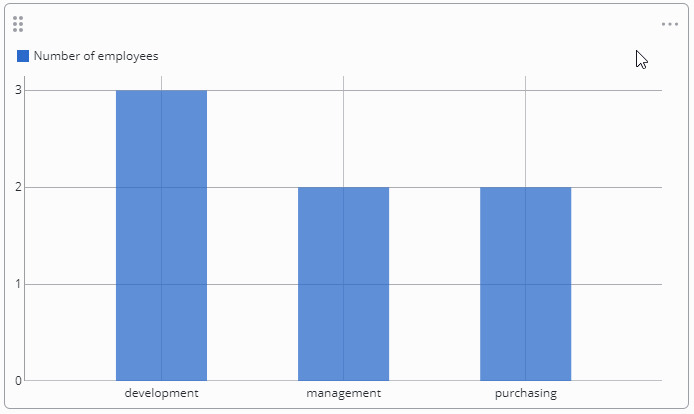
Using count(name)
The solution is represented with the distinct_count aggregate function
Salary pivoted by level, grouped by department
In the previous examples we always had only one data serie (salary or number of employees). It might also be interesting to define the data series based on available data.
In this example we want to see the summarized salaries grouped by department. Furthermore we want to display the data separated by the employees level.
To achieve this we have to group the employees by department and pivot the table by level. This results in the following table:
Department | high | low | middle |
|---|---|---|---|
development | 120'000.00 | 100'000.00 | 110'000.00 |
management | 180'000.00 | 0 | 150'000.00 |
purchasing | 0 | 80'000.00 | 90'000.00 |
The table widget does not support pivoting yet.
This table can be visualized in a chart as follows:
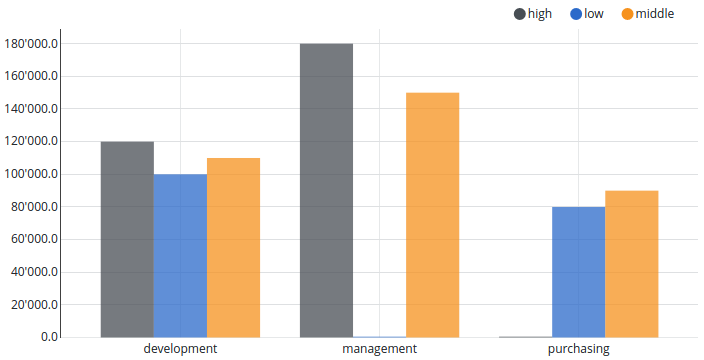
Chart configuration:
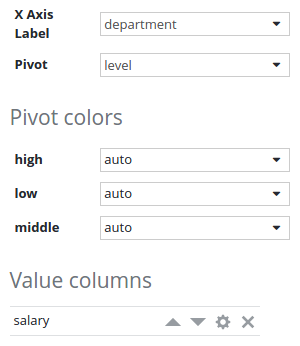
The list of pivot colors is automatically generated using existing data inside the table.
If a pivot column is set, it is only possible to add one value column.
Salary value column configuration: