PDF Report
Edit front page appearance
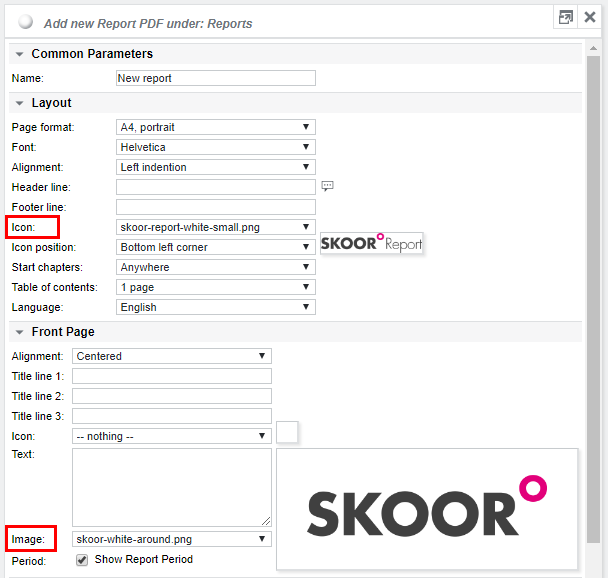
Click Add Report in the function dropdown and select PDF in the Add new Report panel. Click Next, enter a name and define the layout and front page setup.
By changing the Icon and Image Parameters, one can select previously uploaded images to include on the front page or at the bottom of subsequent pages.
Report elements
There are many elements to structure a report:
| Category | Elements |
|---|---|
| Common |
|
| Filter |
|
| Graphics |
|
| List |
|
| Report |
|
Add element
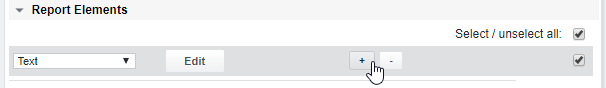
To add a new element, click the + button:
Move elements
In the following example report, we would like to have the SLO availability element in the management summary chapter so this block up must be moved up. Click Unselect all and check the element that should be moved. Click the Up button until the element has reached its desired location.
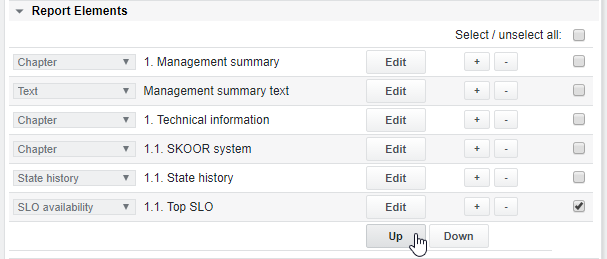
When OK is clicked now with only SLO availability checked, the report will only include this element. This is a good way to shorten a report without the need of creating a new one.
Chapter
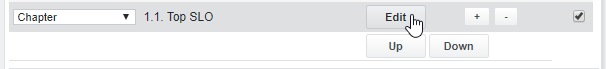
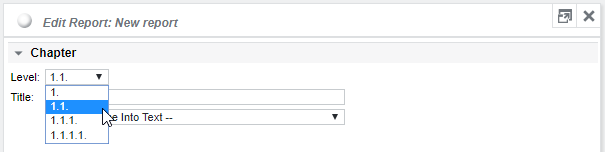
Add a new report element and choose Chapter from its dropdown list, then click Edit.
Select the chapter level (hierarchy) and enter its title:
Image
Select an image previously uploaded via the admin menu to insert to the report.
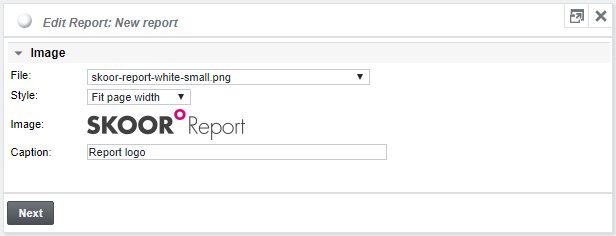
Choose a layout style and enter an image caption (optional).
New page
To insert a new page, add a new report element and select New page.
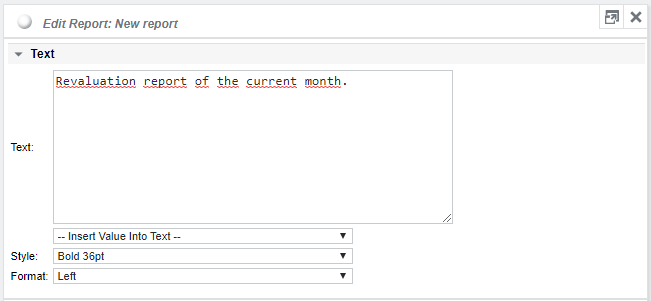
Text
Text file
A previously uploaded text file can be added, allowing to change the content of parts of the report outside of SKOOR Engine dynamically. The supported file types for text files are: *.txt, *.log, *.lst.
Choose one of the following styles to format the file content:
- Line by line - formatted (Courier 8pt)
- Wrap lines – plain text (Helvetica 12pt)
- Table
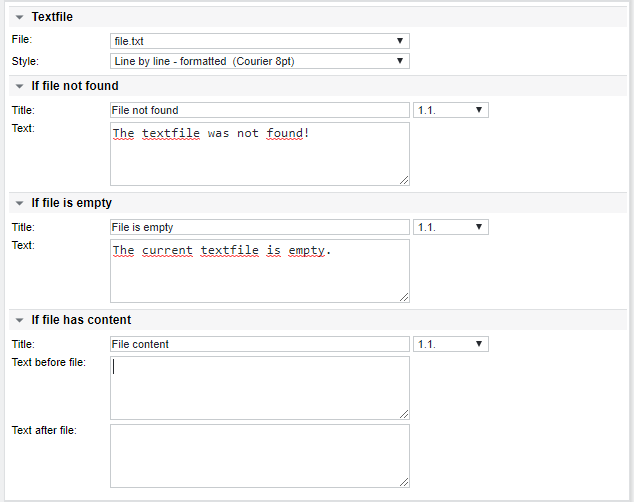
The parameters further down on the Textfile configuration page allow customizing what should be printed in the report if the file is not found, if it is empty or what text goes before and/or after the text in the file.
When choosing Table as Style, the following additional settings can be adapted:
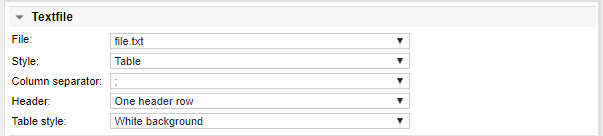
Table settings:
| Column separator |
|
| Header |
|
| Table style |
|
Filter
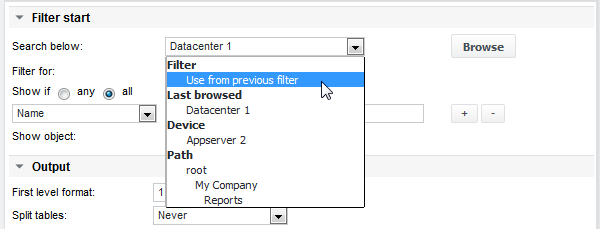
The Filter Start element defines a set of objects concerning the filter criteria (tree structure, type, sub-type, name, custom fields, state etc.).
After the Filter Start one can define other elements like Value History, State History etc. which will be applied to the previous filtered objects.
Filters can also be nested. The inner filters only consider objects from the outer filter as input. To define a nested filter, select Use from previous filter in the Search below section of the filter.
The filter section closes with the Filter End element:
Example filter for jobs:
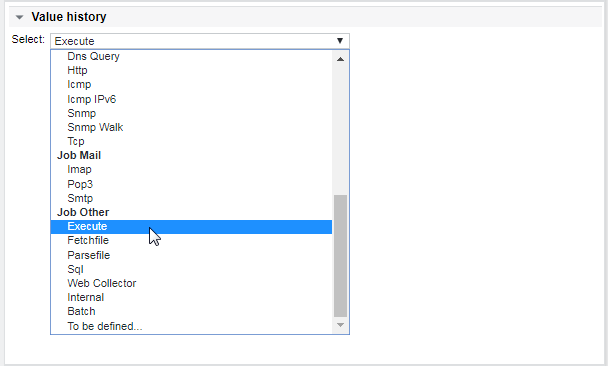
In the following example, the group Devices is chosen as entry point for the filter. Filter objects will only be searched below this group. In this case, one would like to consider only jobs of subtype Execute. It is recommended to test filter criteria using the Admin search option first.
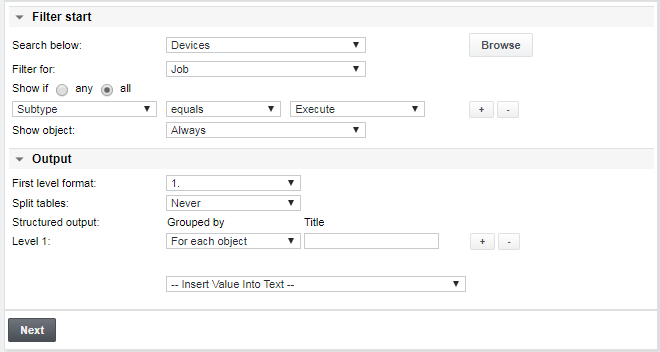
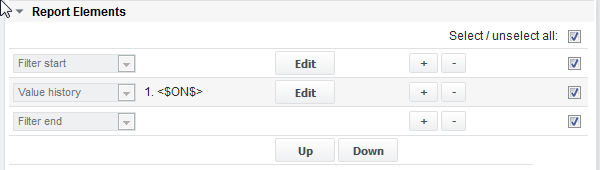
Click Next. For each of the found Execute jobs, a Value History should be printed. To achieve this, add a new report element of type Value history and configure it using the following options:
To automatically have the job’s name entered as title for the value history graph, use the special string <$ON$> for the Title text field:
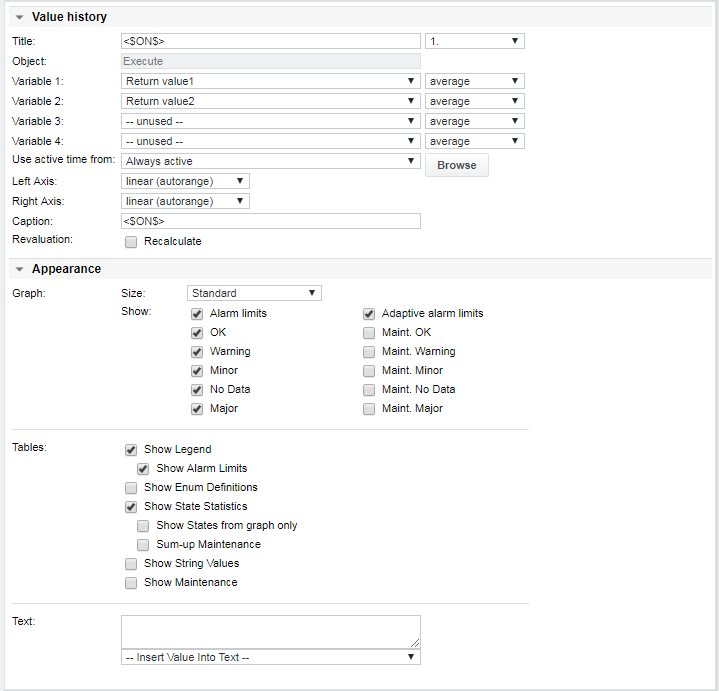
This special string can also be entered automatically by choosing from the lowermost dropdown list -- Insert Value into Text --. Many more dynamic strings are available from this menu.
The next figure shows the output of the above configuration in a report.
The graph title contains the job and device name provided by <$ON$>. As configured in the Graph section, the state of the job is shown by its color:
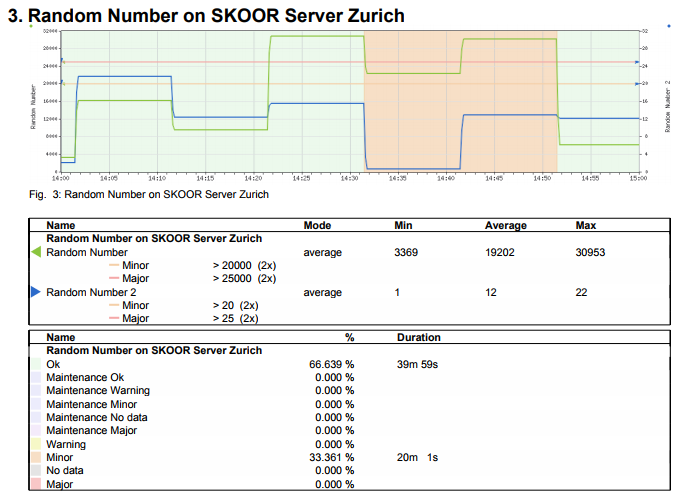
Below the graph, legend and state statistics tables are visible as configured in the Tables section.
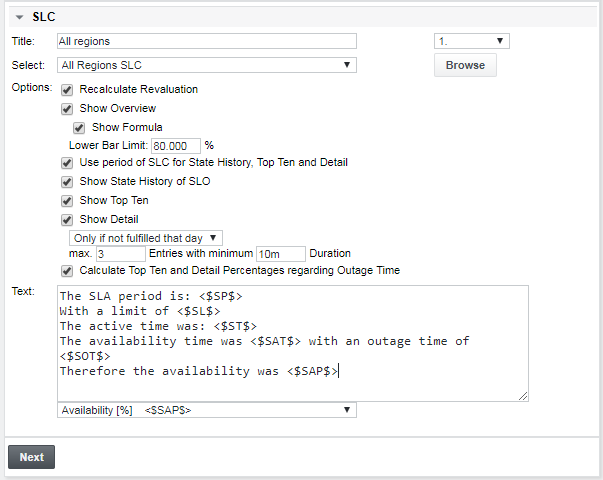
SLC
Service level controller can also be included in reports. In the respective report element, browse for the desired SLC using the Browse button.
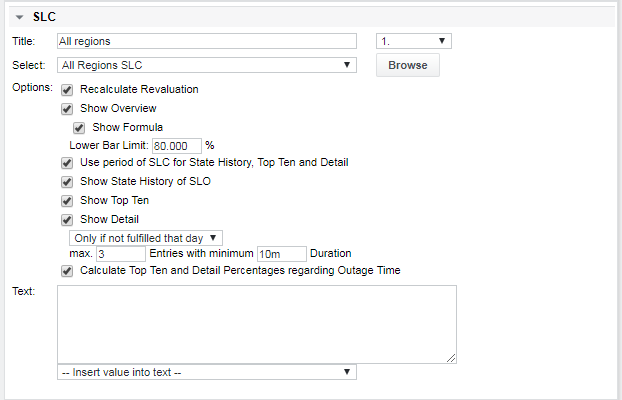
The following are example results of the options:
Entering a lower bar limit of 80% will condense the horizontal bar to the segment 80%-100%, leading to better visibility of low percentage values on the “failed” right end of the bar:
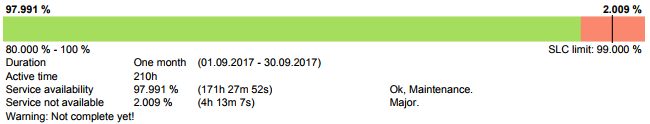
Another example, where the Text block contains special variables, like the fulfillment state, availability, active time etc:
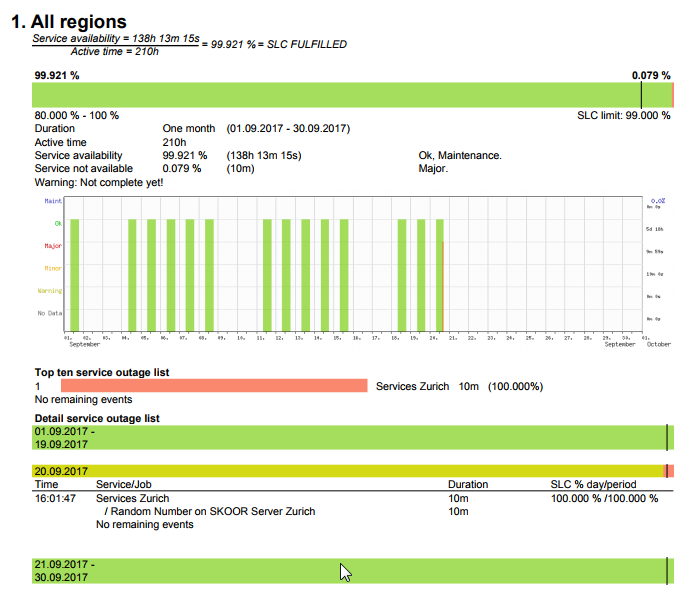
SLC - explanation of SLC details
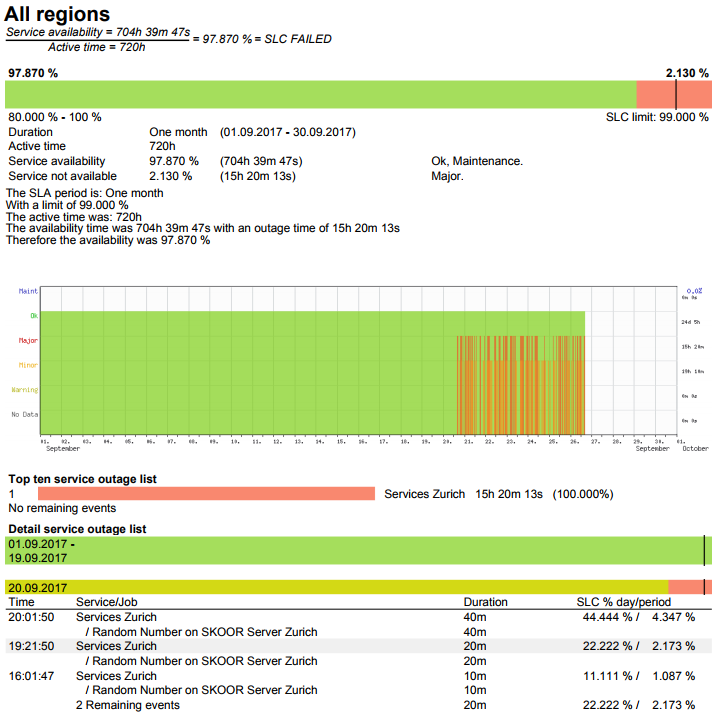
The SLC trend bar is a condensed graphical representation of the availability of the service for the chosen report period.The bold numbers on top of the graph show the service availability (left side) and the duration the service was unavailable (right side). Below the graph at the left side, the start and end percentage of the bar is indicated. 95% is a good starting value. The end, on the right side, represents 100%. The thin vertical marker represents the agreed availability which must be reached to fulfill the SLC.
| Duration | The agreed period of the SLC (e.g. 1 month) |
| Active time | The active time for this SLC period. The example above was calculated from a month with 21 working days, and 10h each day. Active times can be configured in the SLC object |
| Service availability | Service availability (includes the states: OK, Maintenance OK, Maintenance Major)
|
| Service not available | The percentage is calculated from the outage time (configured as in the report definition). The sum of these percentages can easily exceed 100%. Several subservices can have the state Major at the same time |
| Warning: Not complete yet! | This message means that the end of the SLC period is later than the end of the reporting period. (e.g. report period is 1. Sep. - 26. Sep. 2017, SLC ends at 30. Sep. 2017) |
SLC trend bar elements: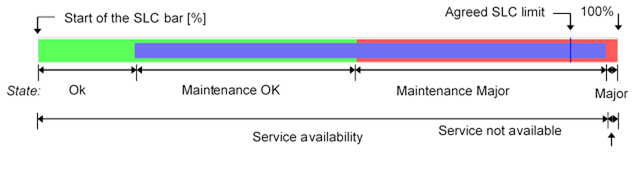
The SLC State history shows all states during the configured active times of the SLC.
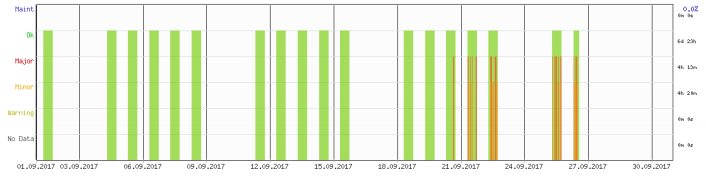
Top ten outages:

The Detail service outage list shows all events during the SLC period: There was no Service outage from the 1st to the 19th of September. The bar is green from 0-100%. At the 20st of September, the service was unavailable for 10 minutes, caused by one outage. This outage took 3.951% of the total outage time at this point. Also, the 10 minutes of this outage crossed the calculated SLC limit of this day which is 6 minutes (1% allowed outages of 210h / 21 days).
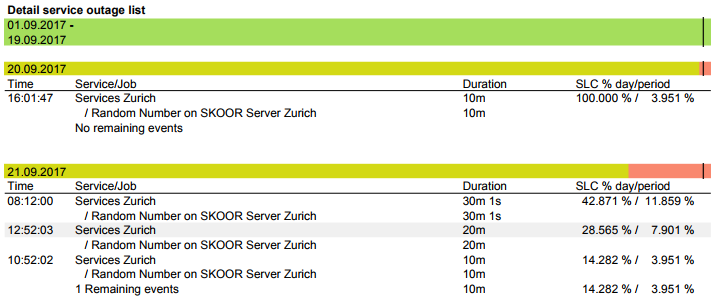
At the 21st, three outages took place. For each outage, the percentage of the day and the total time is displayed. The first outage took 42.871% of the daily outage time and 11.859% of the total outage time.
SLO availability
SLO availability will generate SLC-like output for an SLO during the report period without the necessity to create a specific SLC controller.
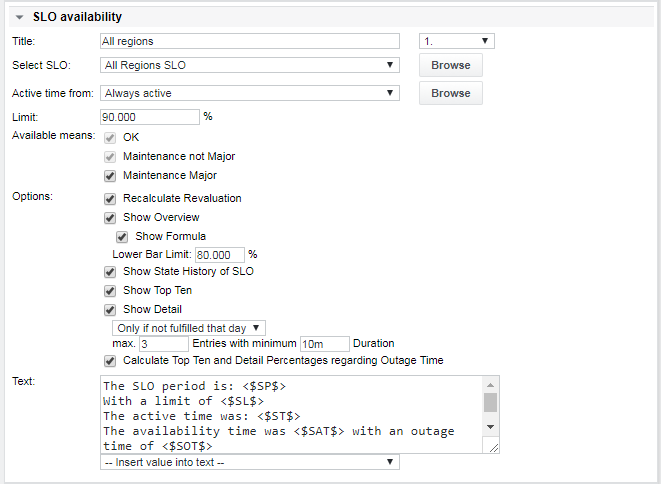
With Active time from, active times can be specified as in SLC configurations:
- Always active: Equal to 7x24
- Default SLC: Use the active time from the first attached SLC
- Select a specific SLC or scheduler for the active time using the Browse button
Refer to the SLC section above for details on the rest of the parameters.
Example SLO availability report:
Value history
Add a value history element to the report and select one or more jobs using the Browse button, the Select and Combine with droptdown lists. The return values of these jobs can be combined in the same graph.
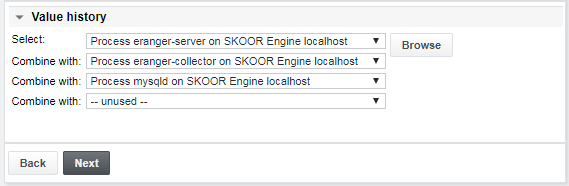
The following example shows an Agent Process job on device SKOOR Engine localhost. The return values of this job can be combined now with the values of all other jobs selected above. Up to 4 variables can be included in the graph. Choose between plotting average, minimum or maximum values of the data. The selectable variables depend on the job type and the actual values it provides.
Now click the Title input field to place the input cursor there. Select Object Name from the Insert Value into Text dropdown menu in the Text section. This automatically adds the real object name to the configuration.
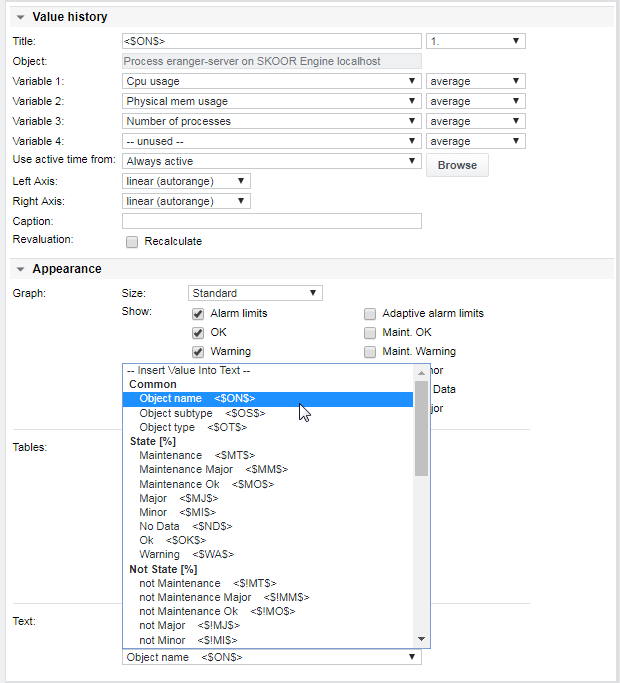
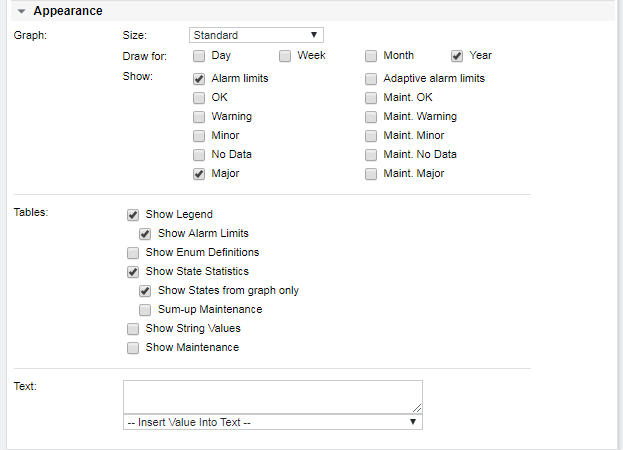
Configure graph size and the required information for the report:
- 3 different sizes (Standard / Small / Tiny)
- Optional alarm limits
- State is background colour
Text section:
- Enter text combined with variables from the Insert Value Into Text menu. The resulting text and respective values from the variables will be displayed beneath every graph
- Example of a dynamic text field: Service <$ON$> was <$OK$>% OK and <$MJ$>% in Major State
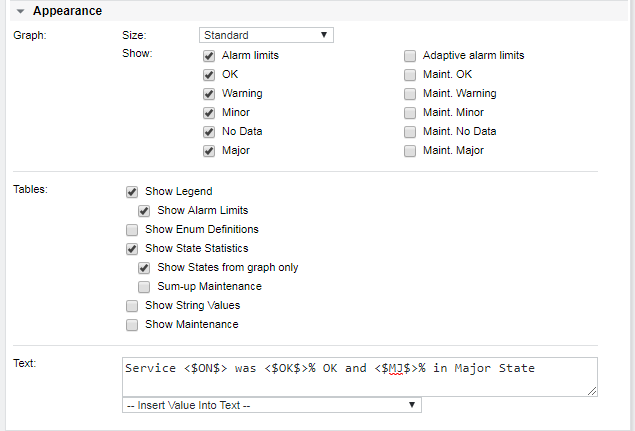
Example report with alarm limits and states in the graph as set in the above Appearance configuration:
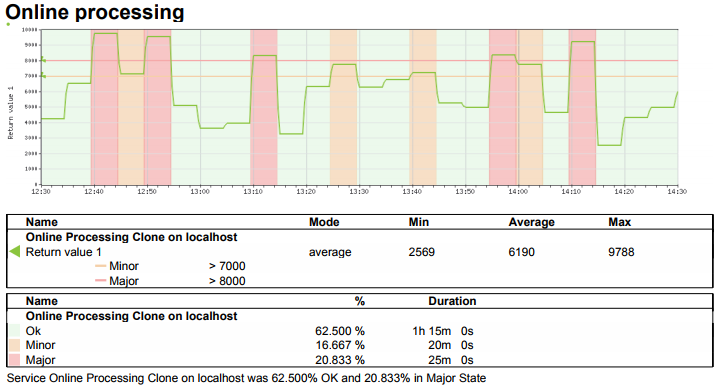
Below the graph, a legend table containing the configured alarm limits as well as the actual Min, Average and Max values is drawn. The last table in the above example is a state statistics table with only states that also appeared in the value history graph (Show states from graph only). Finally, the configured text with percenctage for ok and major state is written below the tables.
Value history plus
This element is similar to the Value history element but provides four plots with predefined time ranges (day, week, month and year).
Configure graph size and the required information for the report:
Graph section:
- 3 different sizes (Standard / Small / Tiny)
- Selectable periods (Draw for day, week, month and/or year)
- Optional alarm limits
- State is background colour
Tables section:
- Optional alarm limits
- State statistics (only available if exactly one period is selected in the Graph section)
Changelog
An object’s or user’s changelog may be printed in a report by adding the Changelog report element:
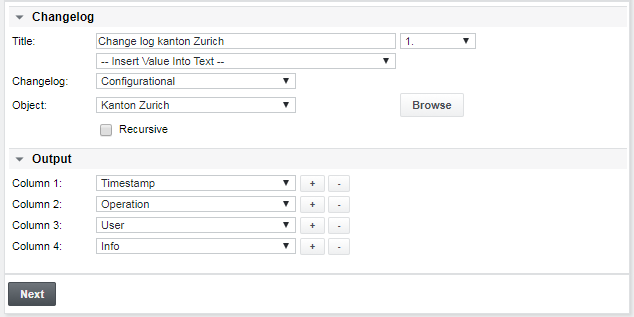
The changelog entries in the output can be narrowed down by specifying from the Changelog dropdown list the following items:
| Changelog type | Output |
|---|---|
| Configurational |
|
| |
| |
| All entries | This option can be further filtered by the Show logins dropdown list (only available when User related or All entries was selected):
|
| User login summary |
|
If the Recursive checkbox is checked, all changes that were made during the report period on objects on or below the selected object will be listed.
Revaluation
Generates a list of all types of revaluations.
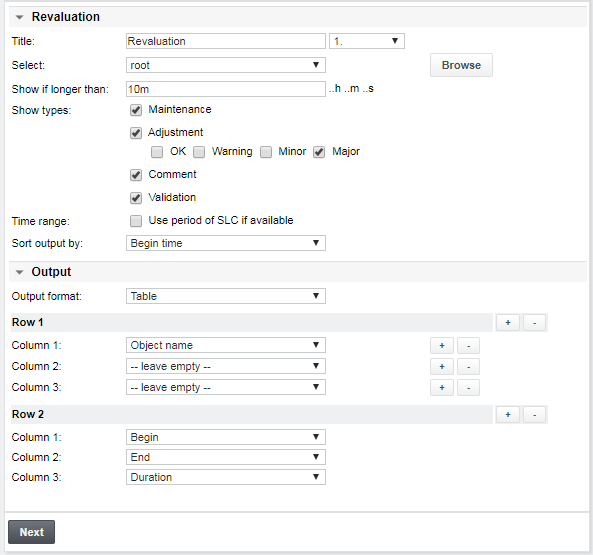
The output table can be configured in the Output section with multiple rows per item. If rows are added, all of them will have the same number of columns.
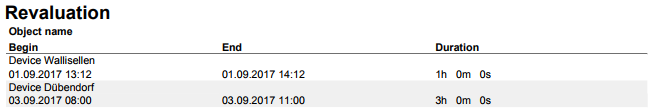
Example Output:
State statistics
Add a new report element of type State statistics to the report and press the Edit button. In the first part of the next screen, define a title and filter the objects that should be displayed in the report:
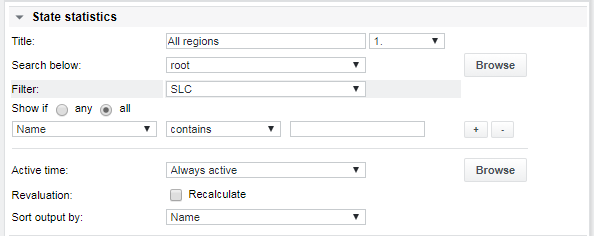
In the Output section, define the columns of the resulting table:
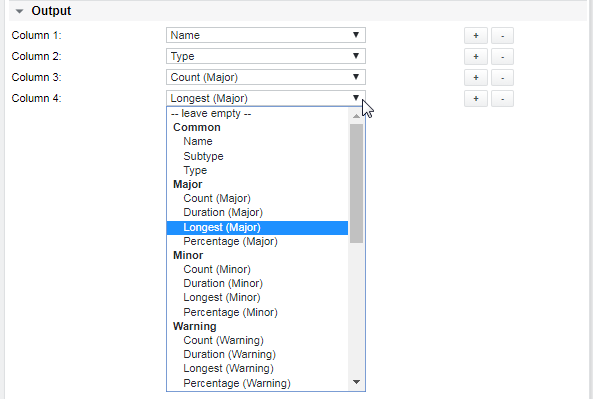
The columns can also contain properties or custom properties of the filtered objects which are available further down in the column dropdown lists.
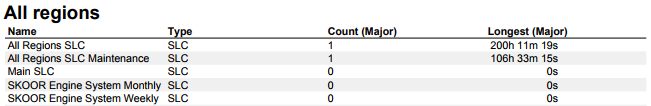
Example output:
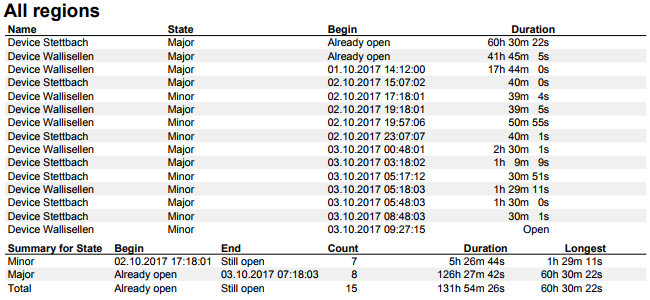
Outage
The outage list will contain only objects which failed during the report time period. The outage report lists outages of groups, SLOs, devices and/or jobs:
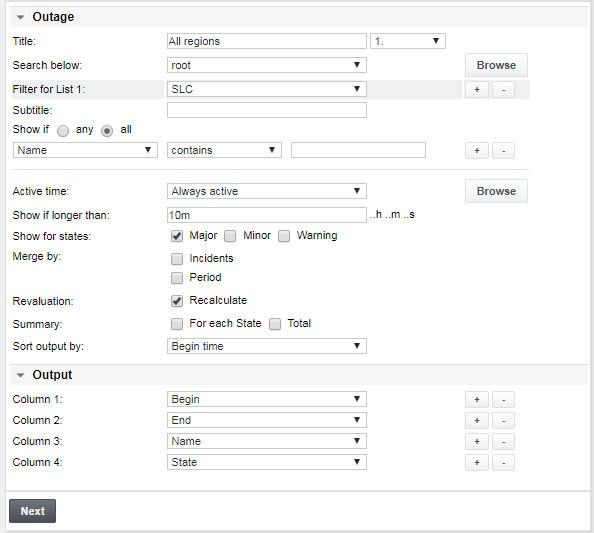
Configuration:
| Item | Description |
|---|---|
| Title | Define a title and optionally attach a chapter structure (1. / 1.1. / 1.1.1 / 1.1.1.1 or text) |
| Search below | Define a parent object below which the filter searches for objects or use the root object for the whole system scope. |
| Filter | Define up to 3 individual filters within one outage report element. For every filter the object type and the specific filter criteria have to be defined. Select an SLC controller as an object type, the outages of the underlying SLO will be listed, but only if these are within the active time of the SLC. A subtitle can be defined per filter |
| Active time |
|
| Show if longer than | Define the minimum outage time that an outage needs to last to be listed |
| Show for states | Define the states (Major, Minor, Warning) that should be counted as an outage. Also, recalculate maintenance is possible |
| Merge by |
|
| Revaluation | If Recalculate is checked, revaluations are calculated into states |
| Summary |
|
| Sort output by | The outage list can be sorted by Begin Time, Duration, State or Name |
| Output / Column 1-10 | Up to ten output fields are supported. Possible field types include:
|
Example output with columns Name, State, Begin and Duration and summaries for states as well as a total:
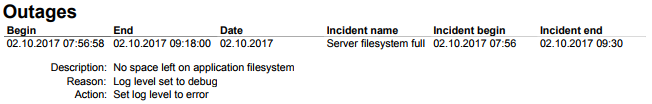
Example output with Merge by incidents checked. Description, Reason and Action of the incident are always displayed, regardless which column content is selected:
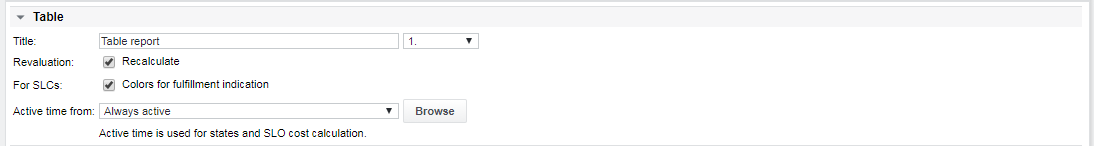
Table
Tables with values can also be integrated into reports.
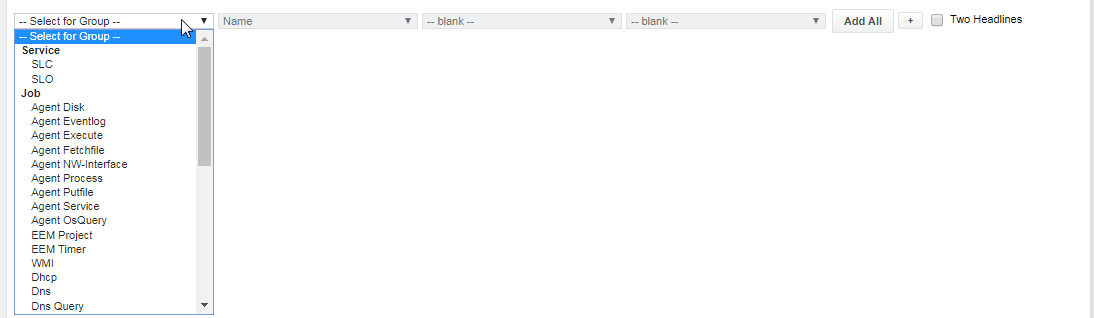
Add or remove columns with the plus or minus buttons and use the Browse button to select the appropriate tree objects where search filter settings should apply. A maximum of 6 columns is supported for tables:

The leftmost dropdown menu offers a selection of all available group types. All other columns are content related and will adapt to the type selected here:
To have 2 header lines, check the box Two Headlines. If all available objects of the Group selection should be added to the table, click Add All. Afterwards, unwanted objects may be removed again using the minus buttons. If Objects have been browsed and selected before, the button changes to Add Selected and will add these objects to the table.
If long names or values must be displayed in the report, a blank column can be added after the respective item to avoid truncation.
To browse all jobs, navigate to the related collector. All jobs are listed there.
Example configuration with two selected devices and two header rows:

Resulting table:
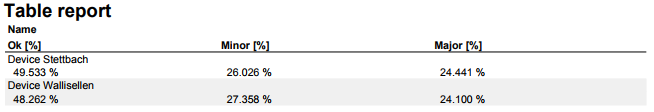
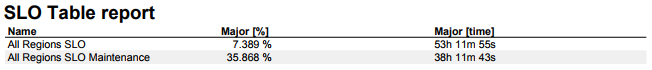
Example: SLO table
For tables with SLOs there are 3 choices for the Active time setting:
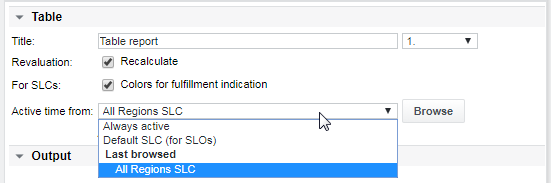
| Active Time setting | Description |
|---|---|
| Always active | Include state information from the report period |
| Default SLC | Include state information from the active time defined on the SLC which Is linked to this SLO. This will use the first SLC which is linked to the corresponding SLO |
| Last browsed - Select generic SLC | Include state information from the active time defined on a specific SLC (use Browse button to select it). All SLOs in the table will use this Active time |
Select SLO as group object, then click Add All or Add Selected if SLOs have been browsed and selected before. Then, select the required output fields:
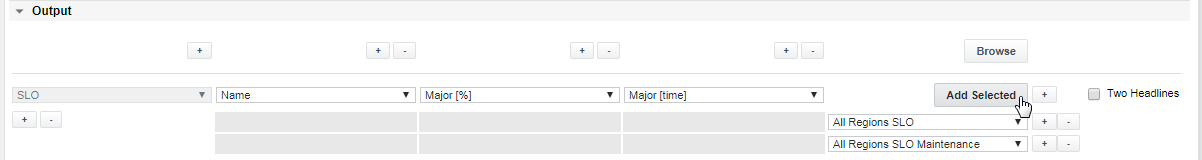
Output:
Example: SLC status table
To reflect states of SLCs and/or jobs at the end of a report period within a table report, the Text [Status], Icon [Status] or combined Icon and text [Status] fields can be used.
To configure such a table, choose either SLC or the desired job type from the leftmost dropdown menu, then select the required style from the Status output options. This example shows all 3 styles of output for fulfillment of SLCs, together with a fifth column Availability. To add additional columns, click the + buttons on the top row:

Then click Browse to search for those SLCs or jobs that should be included in the table as rows. Mark their checkbox, then confirm with OK. Finally, click Add Selected to make the rows appear below the column headers.
Output:

Icons are drawn larger when 2 header lines are used.
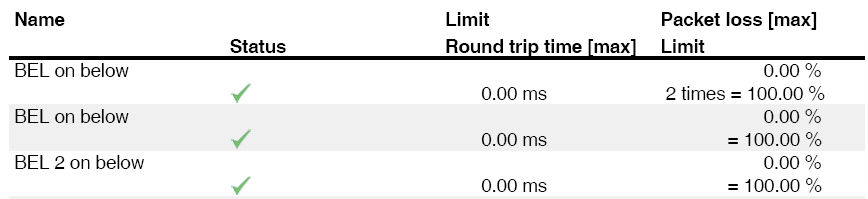
Example: SLC status table including major alarm limits
It is possible to include major alarm limits of SLCs and/or jobs within table reports. The report functionality supports Limits, which prints the major alarm limit and Limits with operator which prints also the defining operator.
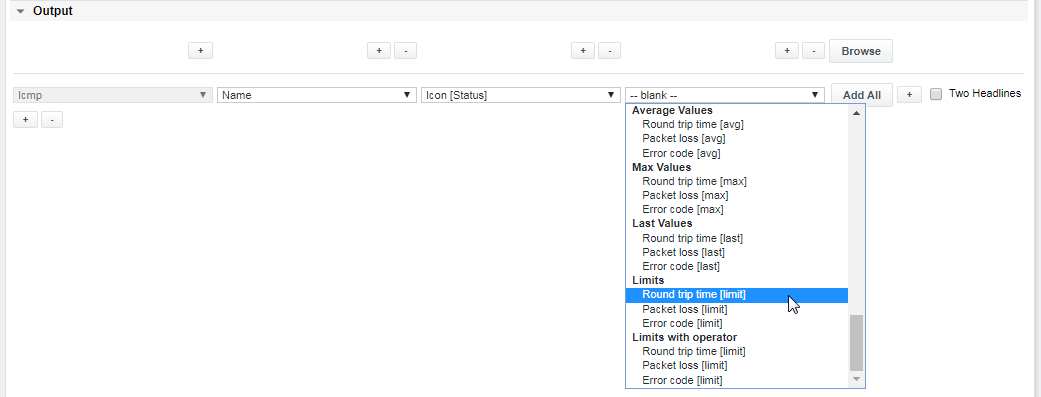
Example output with major alarm limit:

Example output with major alarm limit and operator:
Report
A report can contain other reports as well. Instead of creating 10 long reports which only differ in some parts, it makes sense to build report blocks. For example, build a report with all the disk information and include this in the long reports. If the disk report needs to be changed, one can change it once and all the referring reports include the changes automatically. Selecting the Report PDF report element will present a choice to select all available reports.