Save graph (Value history, Value history plus, State history)
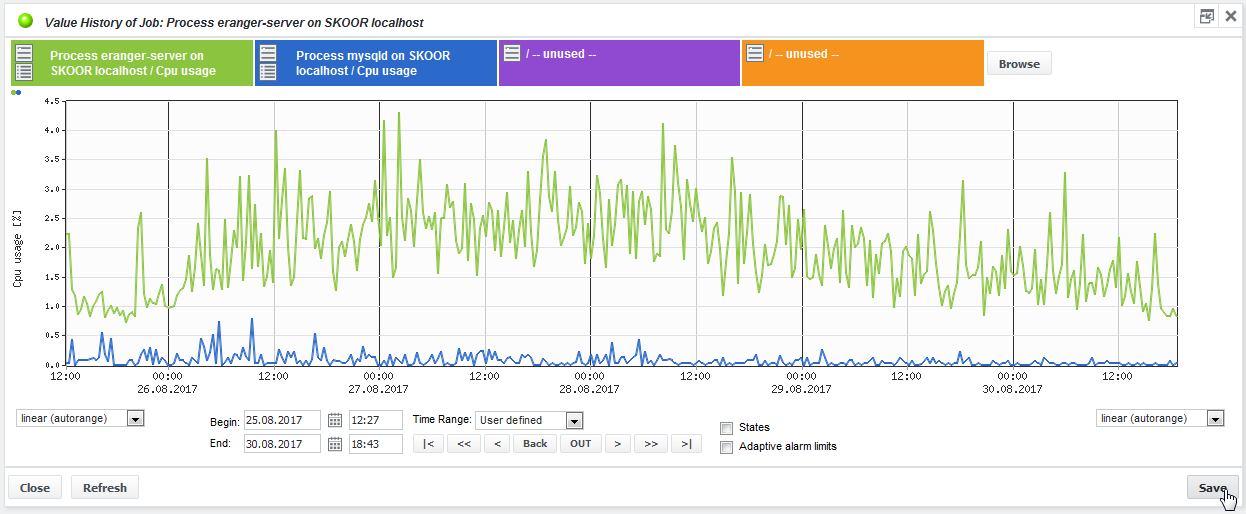
Value history, Value history plus and State history graphs can be saved as a graph object (i.e. a configuration item). This is useful when a specific combination of job values with a specific time range needs to be accessed regularly. The values (possibly from various jobs) are configured once and can then be quickly accessed by simply opening the graph object. Configure the graph (Value history in this example) as desired and press Save.
The following dialog appears:
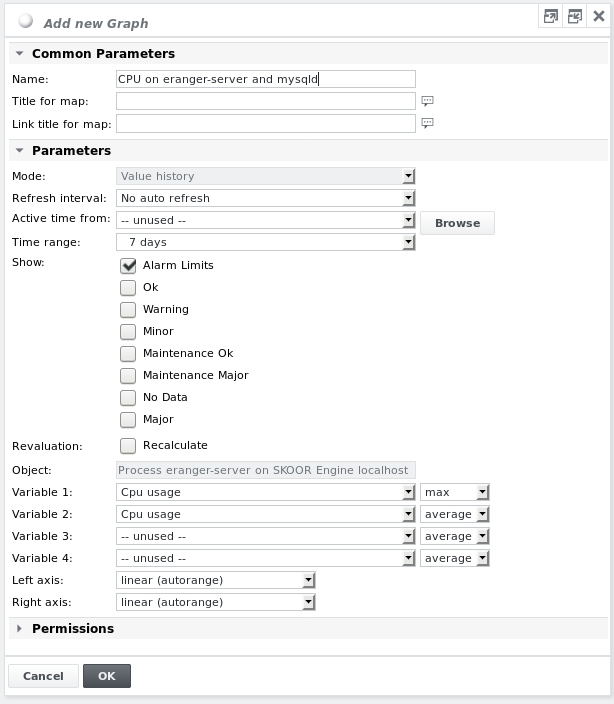
Give the graph a name, specify a time range, then click OK. The pre-configured values and time range settings are saved as a graph object below the current device, but can be linked or moved somewhere else in the object tree if needed.
If the checkbox Revaluation/Recalculate is checked, revaluation (e.g. maintenance) that was defined for the past is taken into account when rendering the graph.
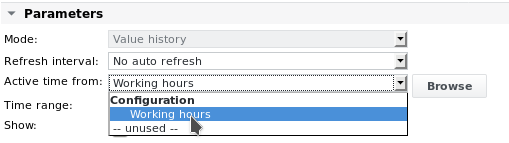
It is possible to limit the values shown in the graph to the time range defined by the active time of an SLC or a preconfigured schedule.
The example figures below show the configuration of the graph as well as the configuration of the schedule Working hours.
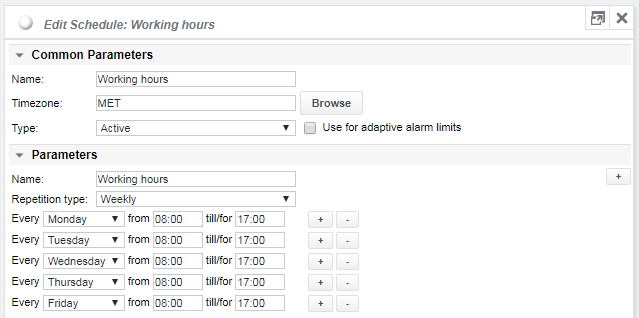
In the graph configuration, browse for and select the above schedule for the parameter Active time from:
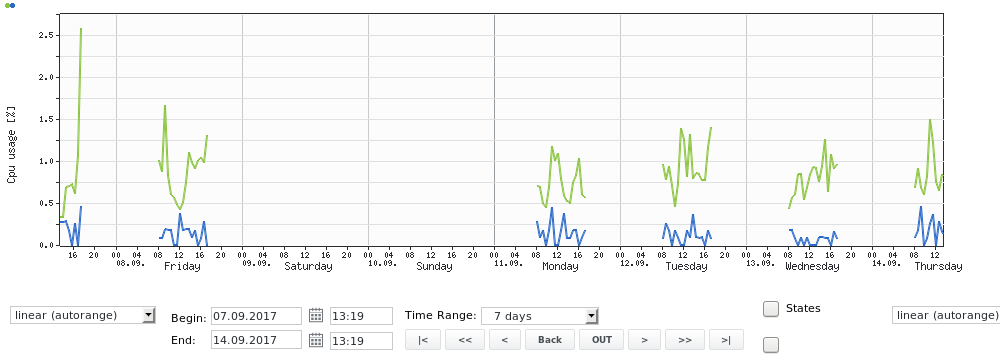
The graph then shows only values for the time ranges defined as active in the schedule:
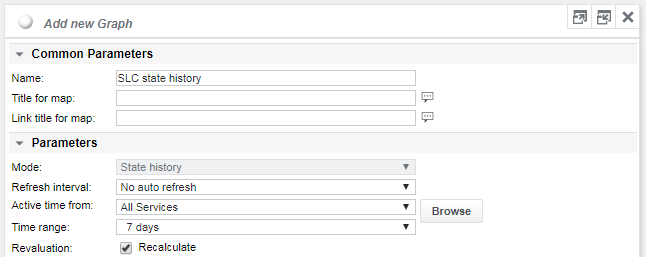
If the graph is a state history, an SLC can be referenced as shown in the example below with the SLC All Services. This will show only the states within the SLCs active time.