Show details
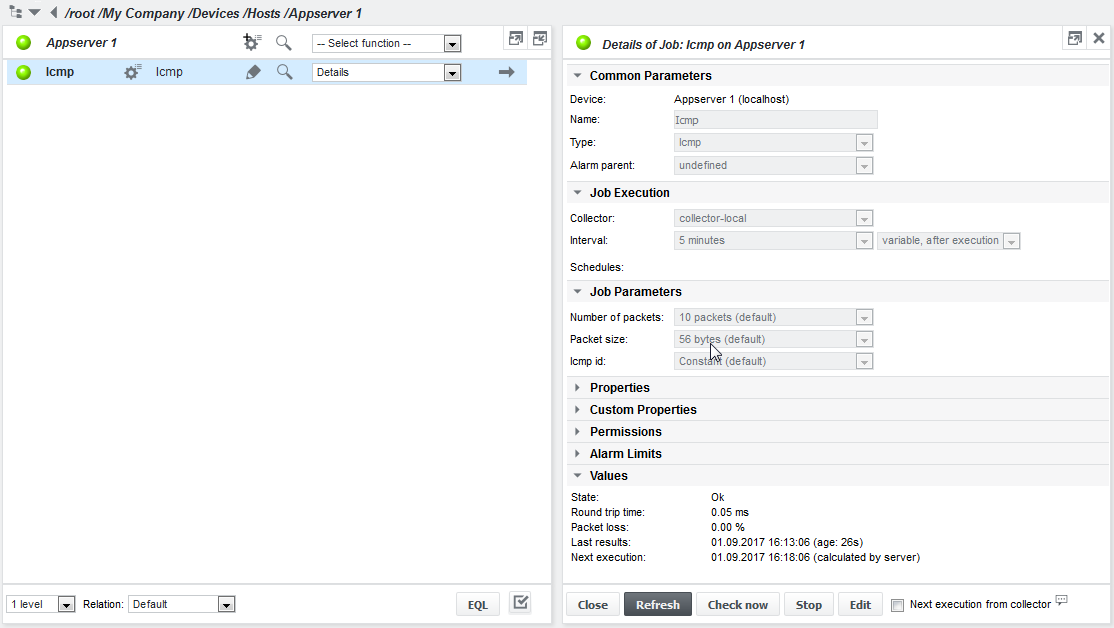
Even a restricted user has access to the Show menu functions. On the job level, choose Show details from the dropdown menu or click the magnifier icon. This will show the configuration information, the values of the last measurement and information about the alarm limits. To force a check and get an up to date value, click the Check now button. If the screen refresh was faster than the measurement, the Next execution entry will show running. In this case, click the Refresh button until the measurement has finished. If a threshold of an alarm limit is reached, the line with the measurement has a coloured background with the colour corresponding to the state.
Example Show details on a job:
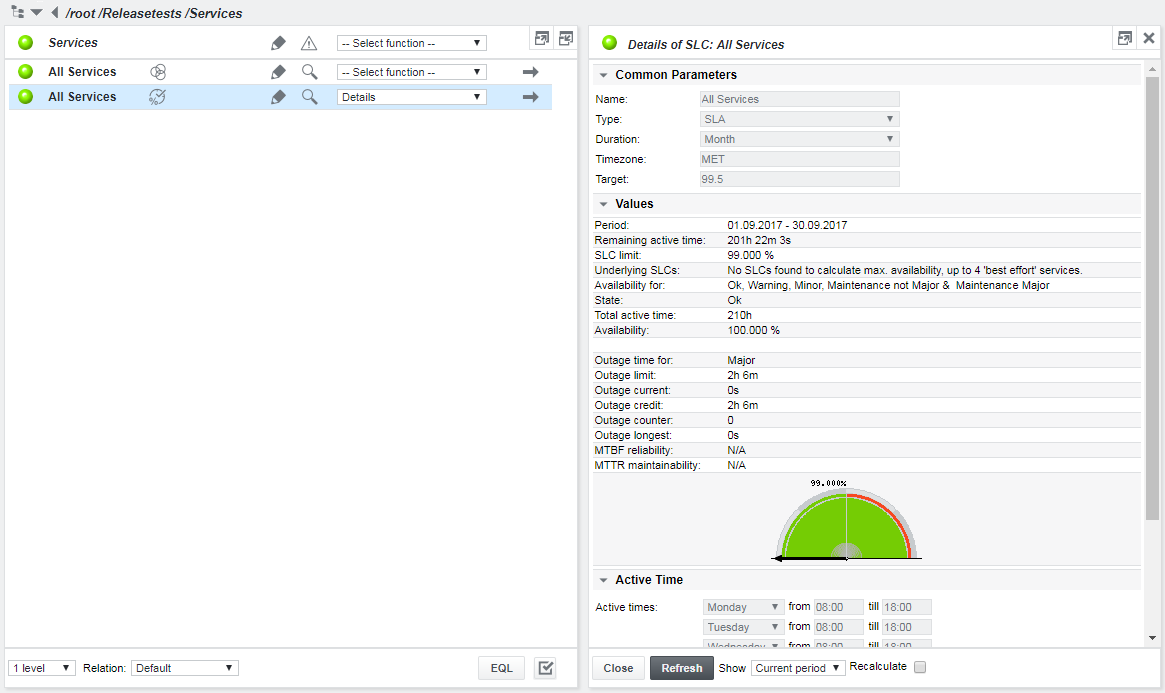
Example Show details on an SLC:
Example Show details on a collector object below /root/Collectors:
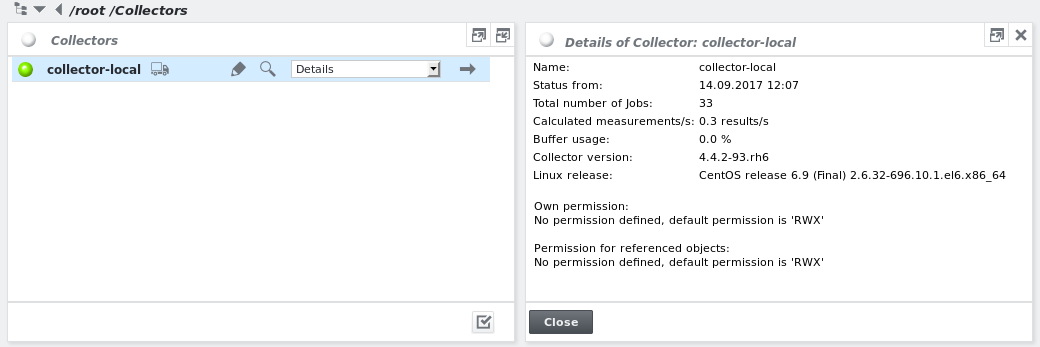
It shows the current state of the collector, the number of jobs configured on the collector, the number of measurements per second that are delivered to the server and the operating system version. The collector object turns red (Major) if the collector is not connected to the server. This might be an authentication or connectivity problem or the eranger-collector service on the collector is not running.