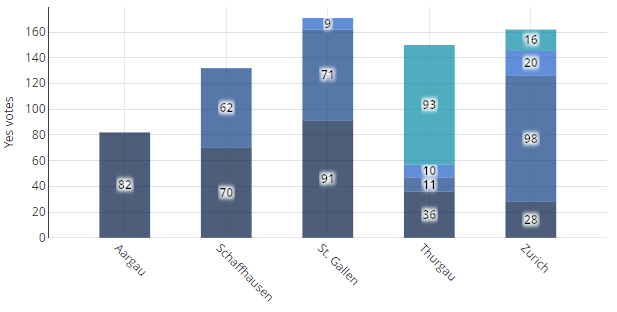
Bar Chart
Bars or stacked bar charts can be created from SKOOR object values as well as from external datasources:
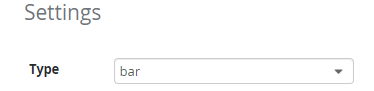
To create a bar chart, a chart widget must be draged from the widget library to a dashboard. In the Settings screen, select bar as chart type:
Load data for the chart using an object filter or an external data source and configure the chart as desired. Numerous settings to colorize, label and present data are available.
Settings
The complete list of settings is documented in the chart overview page. The following ones are especially helpful with the bar chart and multi chart:
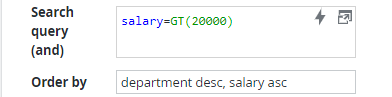
When the search type dataSource is selected, the Search query and Order by fields become visible. The search query editor can be maximized by clicking the respective button in the top right corner. Several statements can be entered there which all must be met by the resulting set of records (and conjunction). If no search query is entered, all records of the selected database table are displayed in the resulting chart. The search query is often used together with a date picker widget to select only records in a specified date range.
With the Order by field, the data in the chart itself can be sorted. For instance, values on the x axis can be ordered as well as stacked values of a bar. Multiple order statements must be separated by a column.
Columns
Data must be prepared in the form of columns before it can be visualized in a bar chart. Pivot and aggregation functions are available to provide a flexible use of the source data.
Simple columns
If no pivot or aggregation is needed, the required columns can just be added by clicking Add column or Sync columns in case of an external data source. Columns can be added or removed any time later as well.

Aggregation
To use aggregation functions such as average, sum, max or min, data must be grouped by at least one column. Aggregation functions must be applied to all other columns.
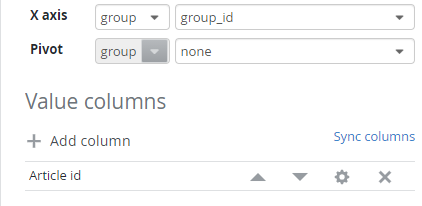
In the following configuration, articles are grouped by the group_id attribute. After that, the number of articles are counted per group. As the group_id and price columns will not be displayed in the chart, they have been removed from the columns list:
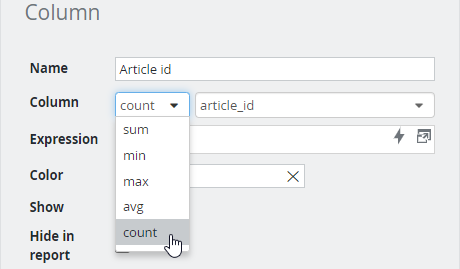
To configure the aggregation function, the column Article id must be edited by clicking the gear icon. In the Column row the count function must be selected together with the article_id attribute:
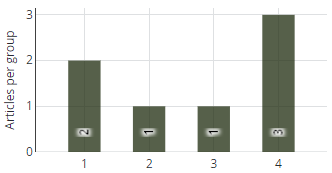
The following simple chart could be the result of this configuration: Article groups 1 to 4 are displayed on the x, the number of articles on the y axis:
Pivot
With pivot, data aggregation goes one step further by aggregating data by value and attribute. Please see our Aggregate functions and pivoting guide for further information.