Geo Map
The Geo Map widget can place SKOOR objects on top of a Google Map, according to the Geo location property defined on the objects. The following map types are available for the base map:
Street map
Satellite
Hybrid
Terrain
Depending on the widget configuration, the map can be interactively zoomed and panned or it simply shows a fixed section of the Google Map.
In addition to the Geo Points, connections between different points could be represented on the map.
Those connections are called Geo Links.
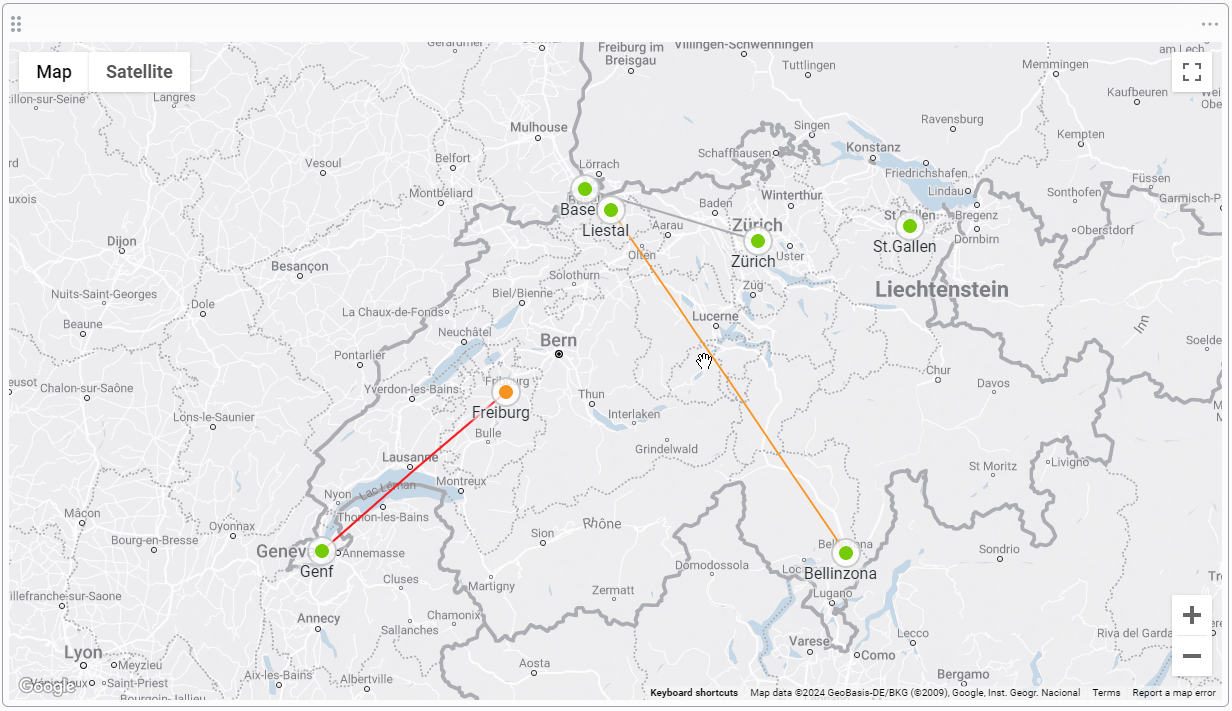
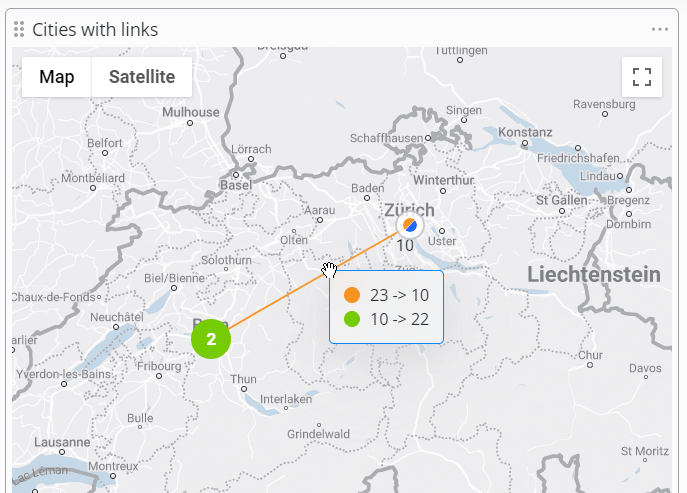
The following figure shows an example of a Geo map widget with several SKOOR objects overlaid on a map of Switzerland, where one object is currently flashing orange (Freiburg).
Additionally, links are represented with their respective state which reflects on the color of the link.
By clicking any of the colored dots (hotspots), details of the object's values and state are shown.
The Geo map widget relies on a connection to Google's servers (from the client's Browser) to visualize map data.
Editing Geo Map widget
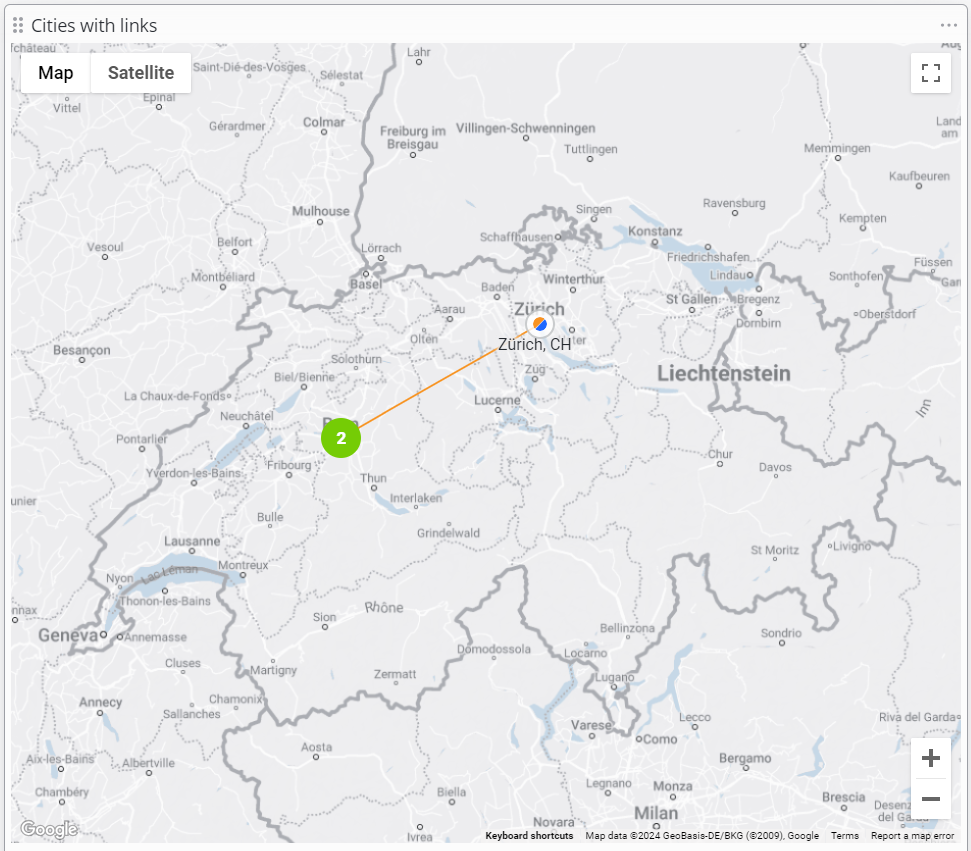
The geo map widget places objects on a Google map using lon/lat coordinates or address information. If multiple objects are located in the same area on the map, a cluster is built which can be clicked to drill down to the single objects. Clusters can contain from two up to several thousands of objects.
The objects on the map are referred to as Geo Points, the Widget can also represent connections between those points, referred to as Geo Links.
Settings panel
Setting | Description |
|---|---|
Type | Street map, Satellite, Hybrid, Terrain. |
Center | Initial map center as LAT/LON (e.g. 47.408384, 8.595708). |
Zoom | Initial zoom level. 0 (whole world) to 21+ (single building). |
Interactive | Activates controls like zooming and panning. |
Directed links | Show arrows on the geo links to indicate their direction. |
Data filters (Geo Points)
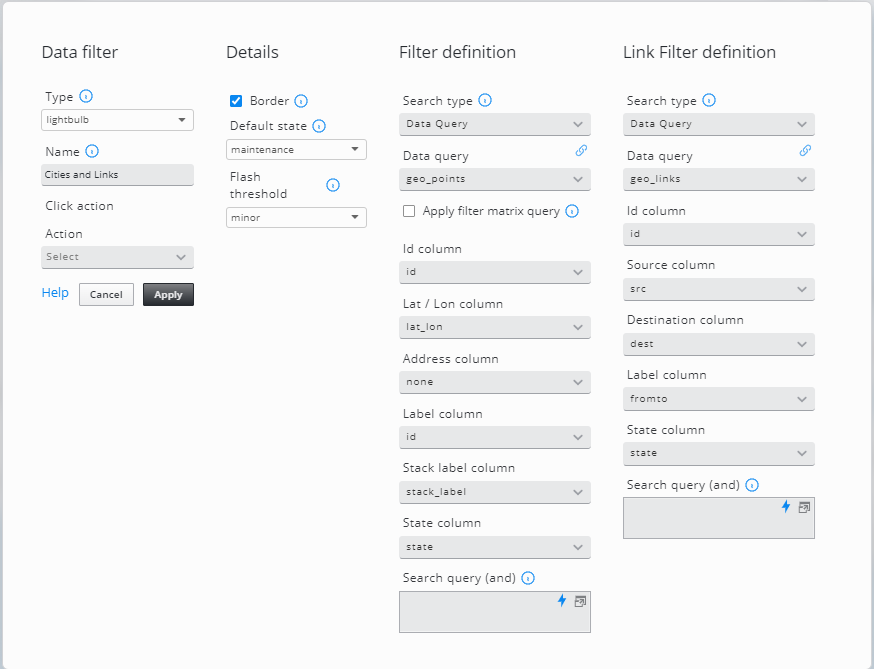
Select SKOOR objects or data from a database to be displayed on the map. To add a data filter click on the Add data filter button.
SKOOR Objects are placed on the map as defined in the object property "Geo Location"
Setting | Description |
|---|---|
Type | Objects can be displayed as lightbulbs or heatmap. |
Name | Name to identify the data filter in the Geo map edit form. |
Click action | Specify an action to be done, when an object on the map is clicked. |
Border | Lightbulb is displayed with or without border |
Default state | Default lightbulb color/state |
Flash threshold | Lightbulbs in this state or worse are flashing |
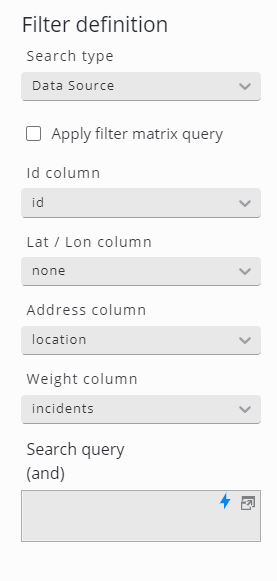
Id column | A unique Id for the geo points (mandatory for identifying the source & destination of a geo link) |
Lat / Lon column | Database column with latitude / longitude values used to position the lightbulbs or heat areas on the map (e.g. 47.408384, 8.595708) |
Address column | Used if no Lat / Lon column is available. The address will be searched on Google APIs |
Label column | Label of geo points/links on the map. |
Stack label column | Label of stacked objects. Will be displayed dependent of current zoom level |
State column | A database column containing the state of a geo point/link. Valid states are ok (green), warning (yellow), minor (orange), major (red), maintenance (blue), no data (grey) or undefined (white) |
Source column | A database column containing the Id of the source point. |
Destination column | A database column containing the Id of the destination point. |
Search query (and) | Use database attributes to filter objects (e.g. |
The Details settings are the same as in Hotspot Map .
Details about the Filter definition can be found in section Object filters.
Heat Map
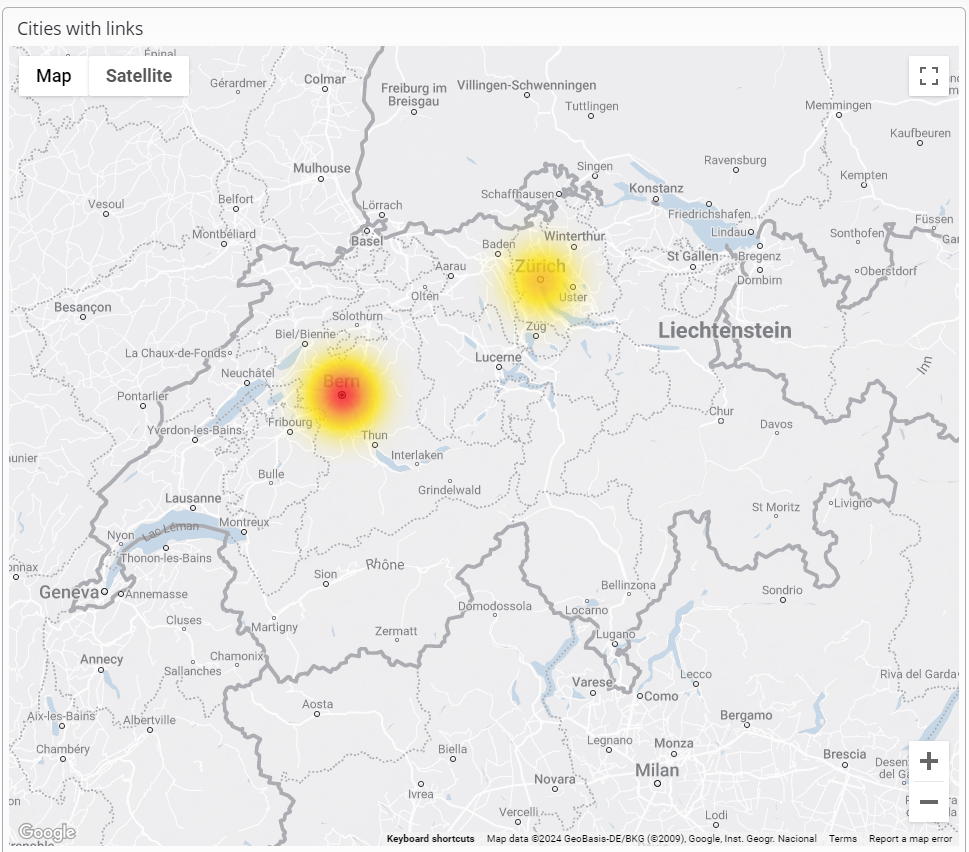
This alternate way to display locations on a map uses an external datasource to provide a numerical weight value.
In the filter definition of the widget, configure either a database column containing coordinates in the Lat/Lon column field or use the Address column field with a database column containing for instance ZIP code and city. For coloration, configure the Weight column. The location with the highest weight (sum of weight column values) is colored in red, the lower values in orange to yellow.
If no weight column is configured, the coloration is calculated from the row count of each location
The label column of Geo links is used to identify the link when a mouse hovers over it.
