Mappa Geo
Il widget Geo Map può posizionare oggetti SKOOR su una mappa Google, in base alla proprietà di geolocalizzazione definita sugli oggetti. Per la mappa di base sono disponibili i seguenti tipi di mappa:
Mappa stradale
Satellite
Ibrida
Terreno
A seconda della configurazione del widget, la mappa può essere ingrandita e spostata in modo interattivo oppure può semplicemente mostrare una sezione fissa della mappa di Google.
Oltre ai punti geografici, sulla mappa possono essere rappresentati anche i collegamenti tra punti diversi.
Queste connessioni sono chiamate Geo Links.
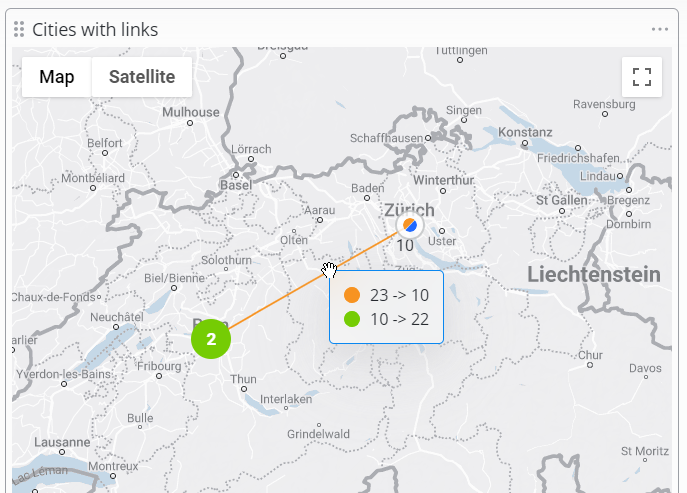
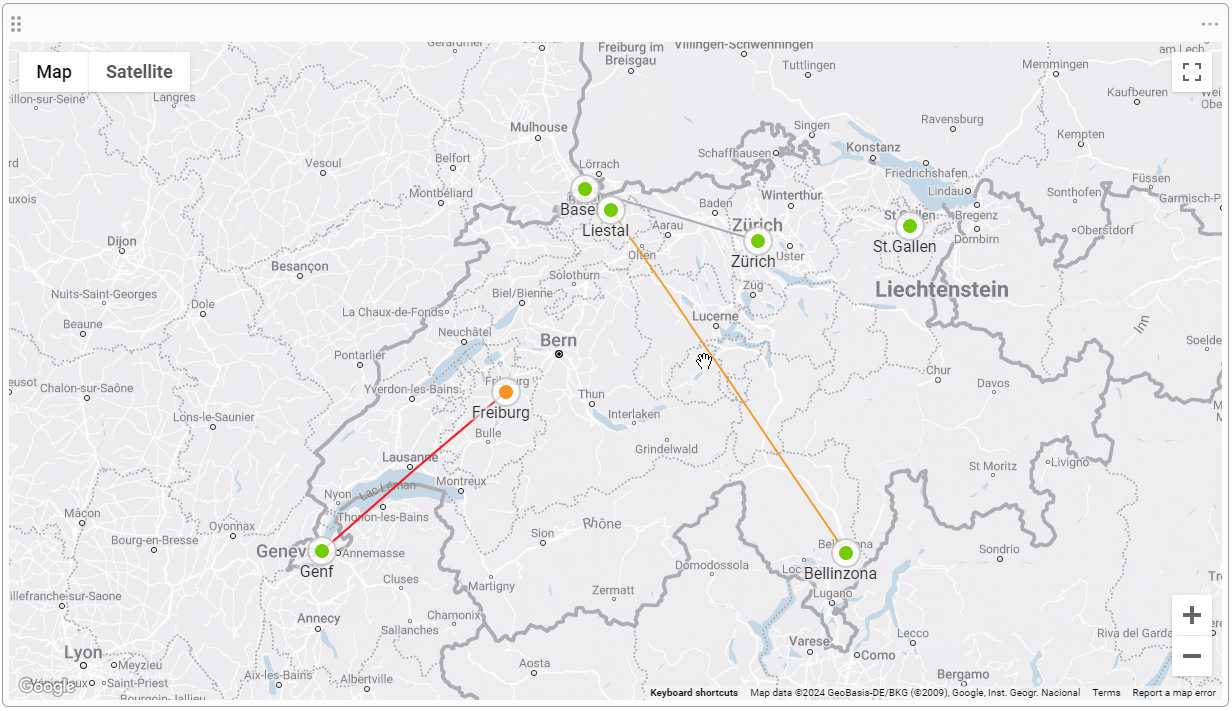
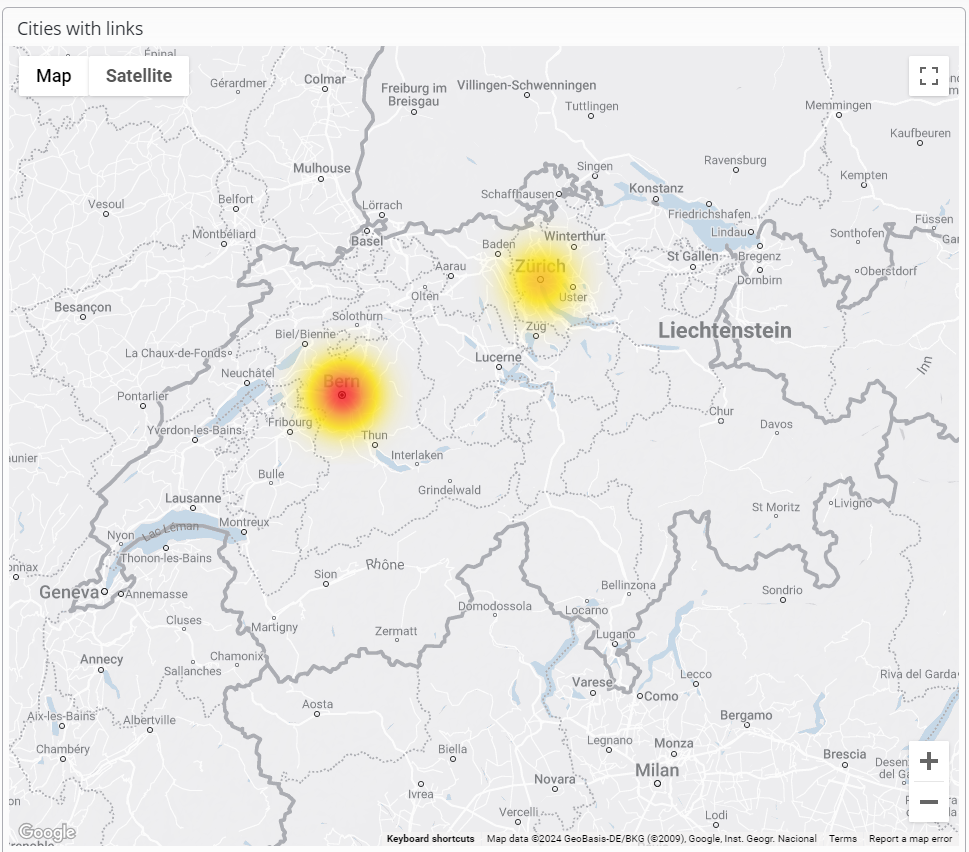
La figura seguente mostra un esempio di widget Geo map con diversi oggetti SKOOR sovrapposti su una mappa della Svizzera, dove un oggetto lampeggia attualmente in arancione (Friburgo).
Inoltre, i collegamenti sono rappresentati con il loro rispettivo stato, che si riflette sul colore del collegamento.
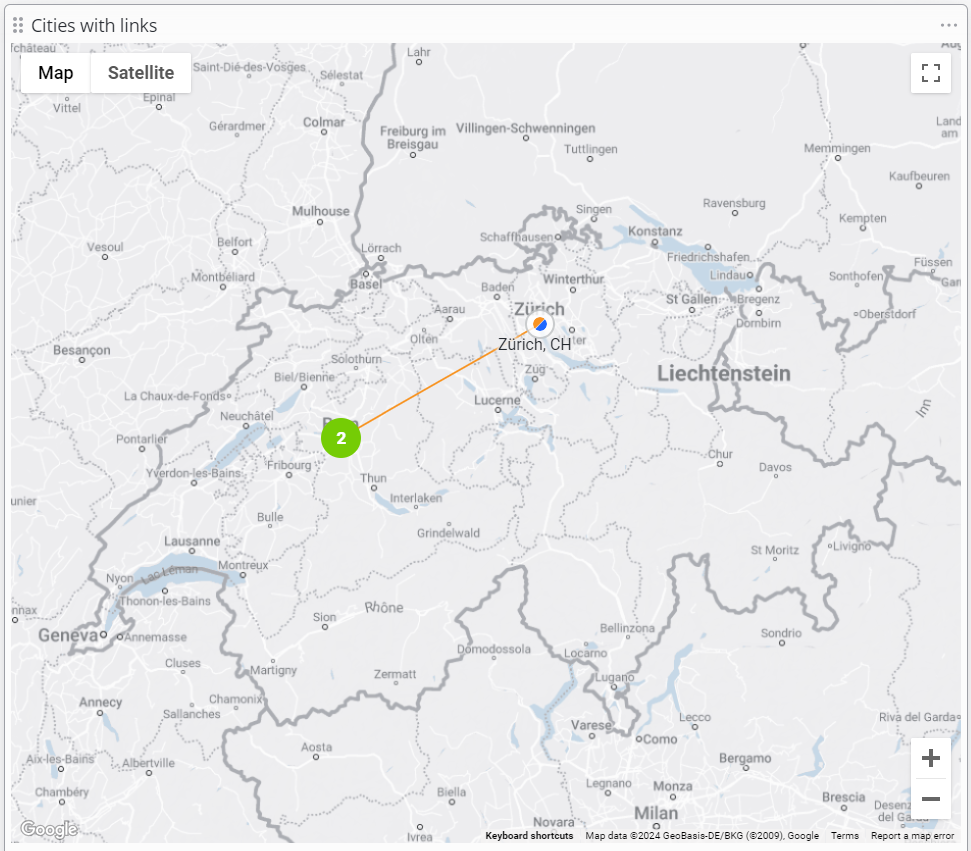
Cliccando su uno qualsiasi dei punti colorati (hotspot), vengono mostrati i dettagli dei valori e dello stato dell'oggetto.
Il widget Geo map si basa su una connessione ai server di Google (dal browser del cliente) per visualizzare i dati della mappa.
Modifica del widget Geo Map
Il widget Geo Map posiziona gli oggetti su una mappa di Google utilizzando le coordinate lon/lat o le informazioni sull'indirizzo. Se più oggetti si trovano nella stessa area sulla mappa, viene creato un cluster su cui è possibile cliccare per approfondire i singoli oggetti. I cluster possono contenere da due a diverse migliaia di oggetti.
Gli oggetti sulla mappa sono denominati Geo Points, il widget può anche rappresentare le connessioni tra questi punti, denominate Geo Links.
Pannello delle impostazioni
Impostazione | Descrizione |
|---|---|
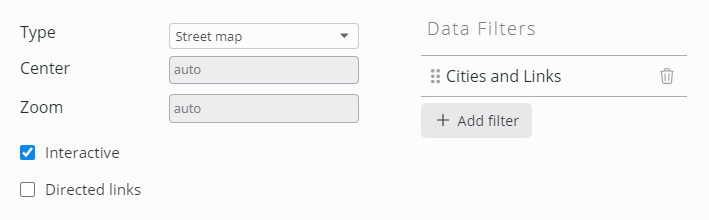
Tipo | Mappa stradale, Satellite, Ibrida, Terreno. |
Centro | Centro iniziale della mappa come LAT/LON (ad es. 47.408384, 8.595708). |
Zoom | Livello di zoom iniziale. Da 0 (intero mondo) a 21+ (singolo edificio). |
Interattivo | Attiva controlli come lo zoom e la panoramica. |
Collegamenti diretti | Mostra frecce sui collegamenti geografici per indicarne la direzione. |
Filtri dati (punti geografici)
Seleziona oggetti SKOOR o dati da un database da visualizzare sulla mappa. Per aggiungere un filtro dati, clicca sul pulsante Aggiungi filtro dati.
Gli oggetti SKOOR vengono posizionati sulla mappa come definito nella proprietà dell'oggetto "Posizione geografica".
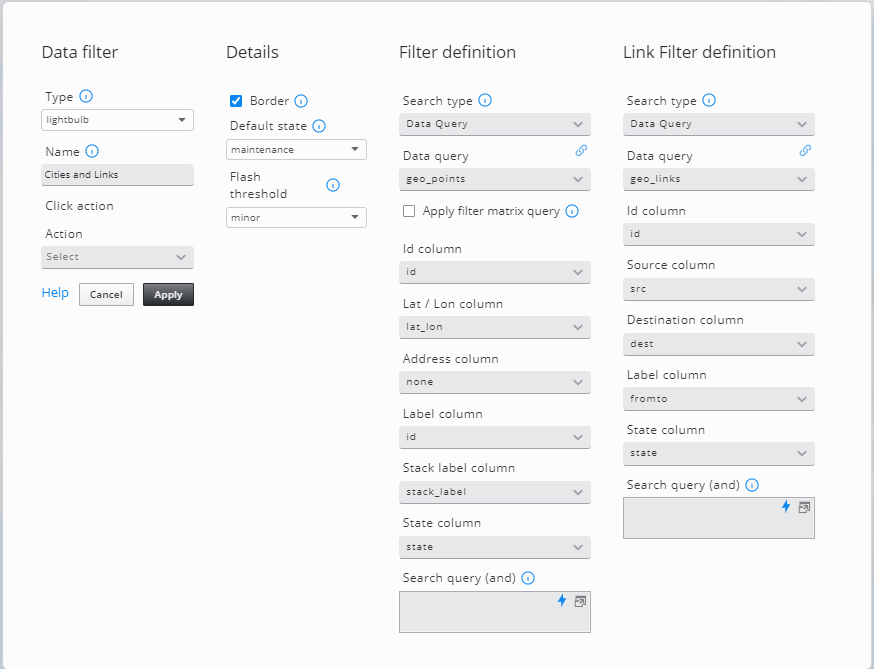
Impostazione | Descrizione |
|---|---|
Tipo | Gli oggetti possono essere visualizzati come lampadine o mappa termica. |
Nome | Nome per identificare il filtro dati nel modulo di modifica della mappa geografica. |
Azione clic | Specificare un'azione da eseguire quando si fa clic su un oggetto sulla mappa. |
Bordo | La lampadina viene visualizzata con o senza bordo |
Stato predefinito | Colore/stato predefinito della lampadina |
Soglia di lampeggiamento | Le lampadine in questo stato o in uno stato peggiore lampeggiano |
Colonna Id | Un ID univoco per i punti geografici (obbligatorio per identificare l'origine e la destinazione di un collegamento geografico) |
Colonna Lat/Lon | Colonna del database con valori di latitudine/longitudine utilizzati per posizionare le lampadine o le aree di calore sulla mappa (ad esempio 47.408384, 8.595708) |
Colonna Indirizzo | Utilizzata se non è disponibile la colonna Lat / Lon. L'indirizzo verrà cercato sulle API di Google |
Colonna Etichetta | Etichetta dei punti geografici/collegamenti sulla mappa. |
Colonna etichetta stack | Etichetta degli oggetti impilati. Verrà visualizzata in base al livello di zoom corrente |
Colonna Stato | Colonna del database contenente lo stato di un punto geografico/collegamento. Gli stati validi sono OK (verde), Warning (giallo), Minor (arancione), Major (rosso), Maintenance (blu), No Data (grigio) o Undefined (bianco). |
Colonna sorgente | Colonna del database contenente l'ID del punto di origine. |
Colonna Destinazione | Una colonna del database contenente l'ID del punto di destinazione. |
Query di ricerca (e) | Utilizza gli attributi del database per filtrare gli oggetti (ad esempio |
Le impostazioni dei dettagli sono le stesse della mappa hotspot.
I dettagli sulla definizione del filtro sono disponibili nella sezione Filtri oggetto.
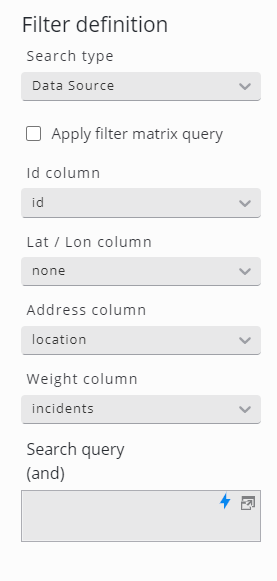
Mappa termica
Questo metodo alternativo per visualizzare le posizioni su una mappa utilizza un'origine dati esterna per fornire un valore di peso numerico.
Nella definizione del filtro del widget, configurare una colonna del database contenente le coordinate nel campo Colonna Lat/Lon oppure utilizzare il campo Colonna indirizzo con una colonna del database contenente, ad esempio, il codice postale e la città. Per la colorazione, configurare la colonna Peso. La posizione con il peso più alto (somma dei valori della colonna Peso) è colorata in rosso, i valori inferiori in arancione o giallo.
Se non è configurata alcuna colonna Peso, la colorazione viene calcolata in base al numero di righe di ciascuna posizione.
La colonna etichetta dei collegamenti Geo viene utilizzata per identificare il collegamento quando il mouse vi passa sopra.