Structuring SKOOR objects
The /root view contains the following objects after the initial installation of SKOOR Engine and Dashboards:
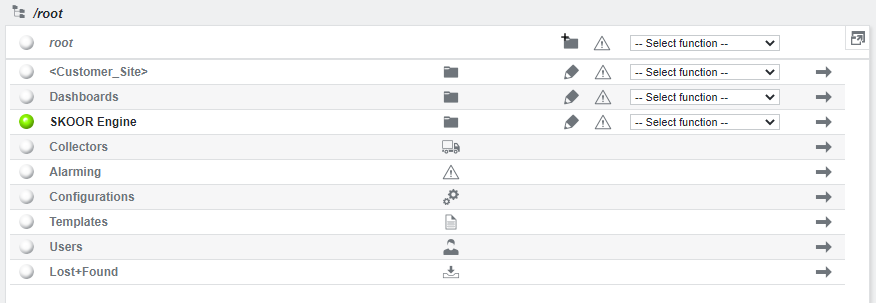
Object | Function |
|---|---|
| Predefined Structure for customer configurations. This is usually the place to work with. |
| A group containing all dashboard objects (including their tiles and widgets) |
| The default group where SKOOR Engine puts devices, jobs and configuration items to monitor itself and its external collectors. |
| A special object containing all SKOOR Engine collectors. These collect all measurements made by the jobs and forward them to the SKOOR Engine server. The default collector is called collector-local and runs on the SKOOR server. External collectors are used to reach hosts in different networks. As collectors are just standard users with the collector flag set, they are created in the Users group. Collectors have a state: ok (green) means they are connected and currently deliver measurement data to the server, major (red) means they are disconnected. |
| A special object containing all alarm devices and alarm groups. |
| A special object containing all configuration objects. By default, it contains subgroups for the following object types:
The following configuration items are deprecated but can be still available on the system:
If for example somewhere else in the SKOOR Engine tree structure an object of type Schedule is created, it will automatically be linked to the /root/Configurations/Schedule Group also. |
| A special object containing all template objects. |
| A special object containing all user and user group objects. |
| A special object containing all objects that have for some reason lost their parent link. There should be no objects below here. |
Recommended object structure
Newly created objects can be grouped in various ways. They can be grouped by location (town, building, floor, company branch) or anything that matches the company or project organization best. Thanks to its open structure, SKOOR Engine makes it very easy to create various views, for example by device type or responsibility. The object structure will vary depending on the customer expectations regarding monitoring. SKOOR engine can be used for technical monitoring exclusively or mainly as an overlay for business and IT service monitoring. Most setups represent a combination of infrastructure and service monitoring. SKOOR recommends setting up such monitoring projects using an object structure similar to the following:
/root<Customer or project name>ConfigurationsGraphsImport / exportOPMSchedule...
DevicesDatabasesEEM (End to end monitoring robot devices)NetworkFirewallsLoad balancersRoutersSwitchesWireless...
OtherPrintersServersServers by locationLondonlx203lx204
Zürich
Servers by OSLinux serversDevProdlx203ICMPDisk spaceCPU / MemoryService slapd
lx204ICMPDisk spaceCPU / MemoryService slapd
Windows servers...
StorageVirtualization hosts
Reports
Business service 1 service report
Business service 1 service report monthly schedulerBusiness service 1 service report weekly scheduler
ServicesSLCsSLA Business service 1 monthlyBusiness service 1
SLA Business service 1 yearlyBusiness service 1
SLOsBusiness service 1Function DBDB Server 1DB Server 2
Function LDAP (correlation rule: 1 of 2)LDAP Server 1ICMP on lx203Disk space on lx203CPU / Memory on lx203Service slapd on lx203
LDAP Server 2ICMP on lx204Disk space on lx204CPU / Memory on lx204Service slapd on lx204
Function NetworkDHCPDHCP 1DHCP 2
DNSNTP
Function Webserver...
IT service 1
The above example shows how one can create a basic structure for service monitoring.
Device inventory
The first step is usually to create the device objects somewhere below the Devices group. Here, the Devices group has been structured by device function (Servers, Storage ...) first, then either by subfunction or other criteria. For example the Linux servers lx203 and lx204 are both in the Servers by OS/Linux servers/Prod group. If one wants to have them structured by location, that is possible too. For this purpose the two devices have just been linked to the Servers by location/London group. The two Linux server devices below those two groups are identical, they have the same object IDs and contain the same measurement jobs. For example renaming lx203 would be reflected below both of its parent groups. Deleting lx203 would delete it in both groups. However, one can just unlink it instead of deleting it, then it would remain below the other parent group.
There are no correlation rules on device or group objects, so it is normal that every job that has a non-OK state pushes its state up to the top of the group tree. Only the Services tree (see below) uses correlation rules for controlling how states are pushed upwards.
Service model
The Services/SLOs subgroup contains the top service objects. These represent the state of the modelled service(s). Below those a model tree is built using Service Level Objects (SLOs), which allow specifying correlation rules for child-SLOs.
After creating or importing the devices and creating the measurement jobs below them, those jobs can be linked below the Services group. Usually, only individual jobs are linked to SLOs, however, one can also link whole devices or groups into SLOs.
Below the top SLO Business service 1 the functions of the service are modelled. The model should represent the dependency tree of Business service 1. For example, the Function LDAP, on which this service depends, is setup so that only one of the two LDAP servers needs to be running. In this example, one of the LDAP servers is not functional because its slapd service is not running. However, the service is still available to the customer. Usually, in SKOOR this kind of setup is reflected using an SLO with a correlation rule (1 of 2). The LDAP function has the state minor (orange), if 1 LDAP Server is down and major (red) if both are down. The SLO Business service 1 is configured so that only major states from the functions below are considered, so it remains in state OK (green) in such a scenario.
The model tree defines, how the states are pushed from job level to the service function and to the top service object.
Service level controllers (SLCs)
The Services/SLCs subgroup contains the service level controller objects. SLCs are usually linked to the top SLO of a service (for example Business service 1) and measure the fulfillment of a service level agreement (SLA) based on a specific time period and an availability target (e.g. 99.9%). The SLA, a contract between a provider of a service and a consumer of a service, establishes measurable agreed to targets of performance and/or availability.
Alarming
SKOOR Engine uses alarm device objects for sensing changes in the states of objects below the device or service tree and acting upon these changes (e.g. sending an email to the person responsible for the device or service). These alarm devices can be combined into alarm groups. In the above scenario, there are usually two alarming paths:
Technical alarming
Measurement jobs below any of the objects in the devices tree notice faults and change their state depending on the alarm limits configured on each job. Each and any of those state changes issues an alarm on the job and the device itself. These technical alarms may not lead to service outages but are nevertheless relevant for technical staff and need to be fixed in the long run. To forward these alarms to the persons responsible (via email), alarm devices or alarm groups are attached to the individual devices or the /root/<Customer or project name>/Devices group.Service alarming
Service managers are usually not interested in technical faults that do not influence their service. However, if any measurements below the service tree are propagated to their top service object, they want to be notified immediately. For this purpose, separate alarm devices or alarm groups are attached to the individual services below /root/<Customer or project name>/Services/SLOs. For example, if the slapd service on both LDAP servers stops running, Function LDAP will turn red and subsequently also Business service 1 turns red. The attached alarm object will send an email to the service manager.
Reports
Reports define customized report descriptions which can be generated manually or by the report scheduler. Usually a single PDF report is configured for each service. It may contain state histories or SLC fulfillment information relative to the time period chosen for the report. The report itself contains the configuration of the contents. For every report one or several report schedulers can be attached which regularly generate an output file based on the report configuration. The report schedulers can also automatically send the generated report to one or more emails addresses.
Apart from PDF, other reports can be configured as well, e.g. CSV or XML reports.