State History
The State History visualizes the state of an SKOOR object on a timeline:
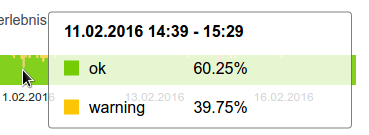
The State history cannot show the exact state at each point in time. This would not be feasible due to performance- and storage-considerations. Instead, the timeline is split into approximately 200 samples. For each sample, the State history shows the percentage of time the object was in a certain state. Moving the mouse over the timeline reveals these percentages:
Display mode
The state history can be visualized in any of the following display modes.
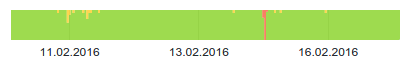
All states
All states that appear in a timesample are shown. The heigth of the state symbolizes its prevalence within the individual sample. The following figure shows the State history using the All states mode:
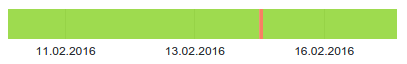
Worst state
This mode shows only the worst state of each sample in the State history timeline. If a sample contains e.g. OK, Minor and Major fractions, only Major is shown for the whole sample. The same State history as above, when viewed using the Worst state mode, would look like this:
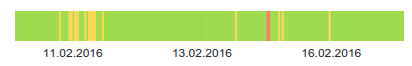
Most frequent state
Instead of the worst state, as above, the most frequent state within a sample is shown in the timeline. The same State history as above, when viewed using the Most frequent state mode, would look like this:
Editing state history widget
The State history widget allows configuring the following parameters:

Setting | Description |
|---|---|
Mode | Display mode: All states, Worst state, Most frequent state (see details here). |
Time range | Default time range to display. |
Page size | If multiple SKOOR objects are found by the object filter, configure the number of objects per page. If more objects are found, a page navigation appears |
Show time zone | Show the respectful time zone of the SKOOR Object below its state history graph. |
Order by | Choose the preferred sort order like Current state or Name from the dropdown |
Click action | Open the details screen of the SKOOR object or a URL when a state bar is clicked. If set to URL, choose whether the URL should be opened as separate window or a dialog |
URL | Specify a URL for the click action. |
Open URL in | Specify how the URL is opened:
|